Zeta Fire Hall
Details
Name: Zeta Fire Hall
Address: 1199 Zeta Ave
Size: 7948 sqft
Year Built: 1979
Floors: 2
Legal Description:
PID:
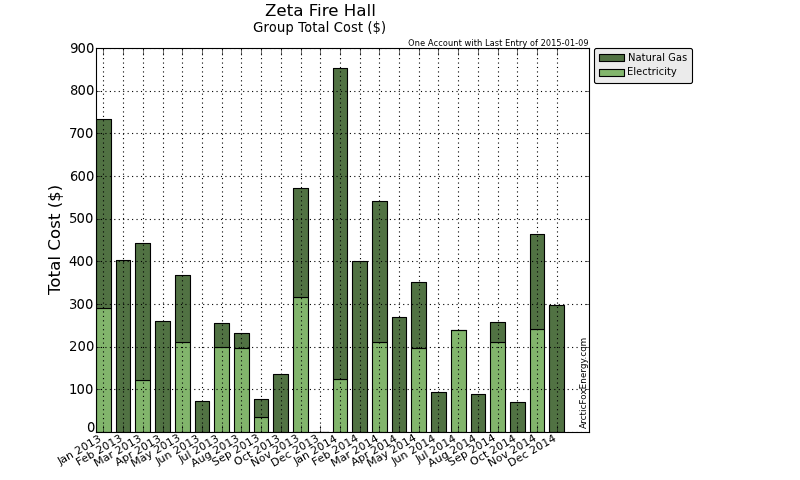
Monthly Electricity Data
| Date | Adj Elec Usage (kWh) | Read Usage (kWh) | Elec Cost ($) | Demand Cost ($) | PF Cost ($) | Total Elec Cost ($) | GHG (tCO2e) |
|---|---|---|---|---|---|---|---|
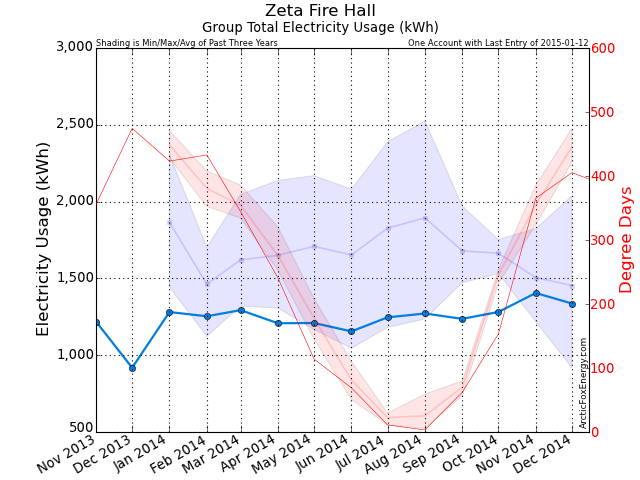
| Jan 2013 | 1,443.53 | 3,755.65 | 255.90 | 0.00 | 0.00 | 290.64 | 0.02 |
| Feb 2013 | 1,122.82 | 0.00 | 0.00 | 0.00 | 0.00 | 0.00 | 0.02 |
| Mar 2013 | 1,319.40 | 1,483.73 | 107.80 | 0.00 | 0.00 | 123.03 | 0.02 |
| Apr 2013 | 1,307.04 | 0.00 | 0.00 | 0.00 | 0.00 | 0.00 | 0.02 |
| May 2013 | 1,167.32 | 2,701.22 | 187.80 | 0.00 | 0.00 | 211.90 | 0.02 |
| Jun 2013 | 1,045.20 | 0.00 | 0.00 | 0.00 | 0.00 | 0.00 | 0.01 |
| Jul 2013 | 1,180.89 | 2,160.09 | 176.68 | 0.00 | 0.00 | 198.07 | 0.02 |
| Aug 2013 | 1,236.35 | 2,034.00 | 174.21 | 0.00 | 0.00 | 196.08 | 0.02 |
| Sep 2013 | 1,471.80 | 426.31 | 31.23 | 0.00 | 0.00 | 35.83 | 0.02 |
| Oct 2013 | 1,705.80 | 0.00 | 0.00 | 0.00 | 0.00 | 0.00 | 0.02 |
| Nov 2013 | 1,219.03 | 3,466.62 | 282.77 | 0.00 | 0.00 | 317.06 | 0.02 |
| Dec 2013 | 918.51 | 0.00 | 0.00 | 0.00 | 0.00 | 0.00 | 0.01 |
| Jan 2014 | 1,281.10 | 1,718.50 | 111.43 | 0.00 | 0.00 | 124.82 | 0.01 |
| Feb 2014 | 1,253.39 | 0.00 | 0.00 | 0.00 | 0.00 | 0.00 | 0.01 |
| Mar 2014 | 1,293.29 | 2,685.84 | 185.97 | 0.00 | 0.00 | 211.36 | 0.01 |
| Apr 2014 | 1,208.08 | 0.00 | 0.00 | 0.00 | 0.00 | 0.00 | 0.01 |
| May 2014 | 1,209.48 | 2,416.15 | 175.70 | 0.00 | 0.00 | 197.50 | 0.01 |
| Jun 2014 | 1,155.08 | 0.00 | 0.00 | 0.00 | 0.00 | 0.00 | 0.01 |
| Jul 2014 | 1,246.37 | 2,387.17 | 214.09 | 0.00 | 0.00 | 238.18 | 0.01 |
| Aug 2014 | 1,271.51 | 0.00 | 0.00 | 0.00 | 0.00 | 0.00 | 0.01 |
| Sep 2014 | 1,236.64 | 2,584.03 | 185.59 | 0.00 | 0.00 | 212.05 | 0.01 |
| Oct 2014 | 1,281.55 | 0.00 | 0.00 | 0.00 | 0.00 | 0.00 | 0.01 |
| Nov 2014 | 1,404.94 | 2,480.41 | 216.88 | 0.00 | 0.00 | 241.27 | 0.01 |
| Dec 2014 | 1,336.42 | 0.00 | 0.00 | 0.00 | 0.00 | 0.00 | 0.01 |
Download Monthly Electricity Data as a CSV file for import into Excel.
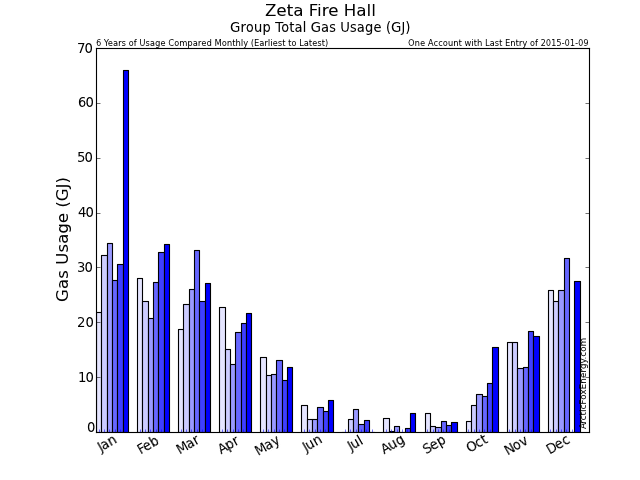
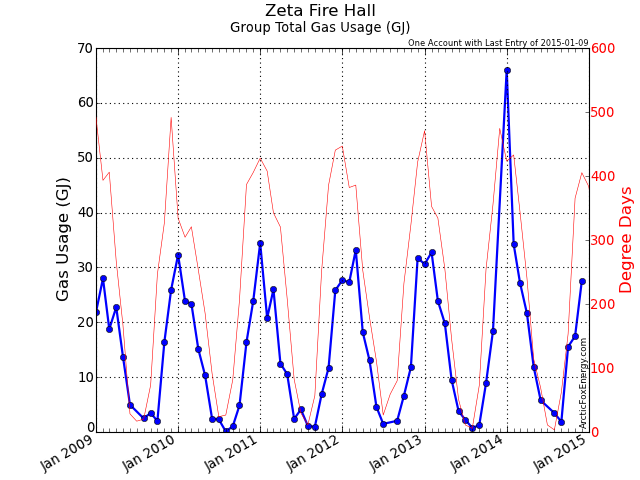
Monthly Gas Data
| Date | Adj Gas Usage (GJ) | Read Usage (GJ) | Gas Cost ($) | Basic / Mgmt Cost ($) | Delivery Cost ($) | Midstream Cost ($) | Total Gas Cost ($) | GHG (tCO2e) |
|---|---|---|---|---|---|---|---|---|
| Jan 2013 | 30.59 | 30.59 | 414.63 | 28.44 | 0.00 | 0.00 | 443.06 | 1.52 |
| Feb 2013 | 32.74 | 32.74 | 378.14 | 25.66 | 0.00 | 0.00 | 403.80 | 1.63 |
| Mar 2013 | 23.90 | 23.90 | 291.81 | 28.17 | 0.00 | 0.00 | 319.97 | 1.19 |
| Apr 2013 | 19.79 | 19.79 | 235.90 | 25.18 | 0.00 | 0.00 | 261.08 | 0.98 |
| May 2013 | 9.52 | 9.52 | 132.36 | 23.57 | 0.00 | 0.00 | 155.93 | 0.47 |
| Jun 2013 | 3.81 | 3.81 | 48.86 | 24.61 | 0.00 | 0.00 | 73.46 | 0.19 |
| Jul 2013 | 2.22 | 2.22 | 27.73 | 28.67 | 0.00 | 0.00 | 56.40 | 0.11 |
| Aug 2013 | 0.75 | 0.75 | 9.79 | 25.88 | 0.00 | 0.00 | 35.67 | 0.04 |
| Sep 2013 | 1.25 | 1.25 | 16.13 | 26.54 | 0.00 | 0.00 | 42.67 | 0.06 |
| Oct 2013 | 8.88 | 8.88 | 112.65 | 23.94 | 0.00 | 0.00 | 136.58 | 0.44 |
| Nov 2013 | 18.42 | 18.42 | 228.37 | 26.53 | 0.00 | 0.00 | 254.90 | 0.92 |
| Dec 2013 | 0.00 | 0.00 | 0.00 | 0.00 | 0.00 | 0.00 | 0.00 | 0.00 |
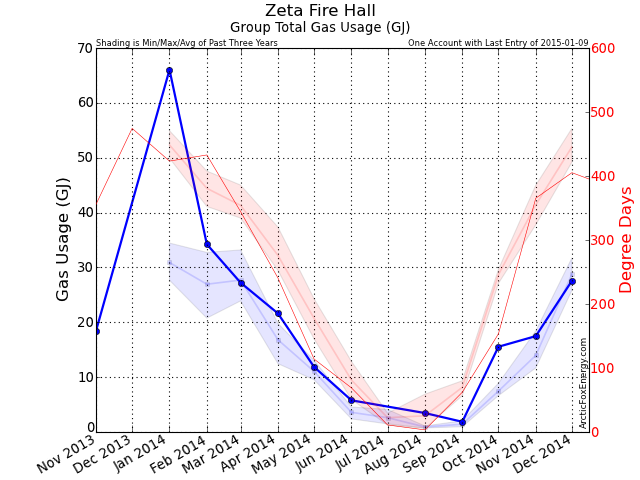
| Jan 2014 | 66.03 | 64.81 | 680.33 | 47.33 | 0.00 | 0.00 | 727.66 | 3.29 |
| Feb 2014 | 34.22 | 35.44 | 373.34 | 28.34 | 0.00 | 0.00 | 401.68 | 1.70 |
| Mar 2014 | 27.23 | 27.23 | 304.14 | 25.79 | 0.00 | 0.00 | 329.93 | 1.35 |
| Apr 2014 | 21.61 | 21.61 | 242.94 | 26.31 | 0.00 | 0.00 | 269.25 | 1.08 |
| May 2014 | 11.86 | 11.86 | 128.79 | 25.99 | 0.00 | 0.00 | 154.78 | 0.59 |
| Jun 2014 | 5.77 | 5.77 | 65.25 | 29.04 | 0.00 | 0.00 | 94.28 | 0.29 |
| Jul 2014 | 0.00 | 0.00 | 0.00 | 0.00 | 0.00 | 0.00 | 0.00 | 0.00 |
| Aug 2014 | 3.46 | 3.46 | 36.78 | 53.41 | 0.00 | 0.00 | 90.19 | 0.17 |
| Sep 2014 | 1.86 | 1.86 | 23.27 | 23.28 | 0.00 | 0.00 | 46.54 | 0.09 |
| Oct 2014 | 15.54 | 3.95 | 45.52 | 25.20 | 0.00 | 0.00 | 70.72 | 0.77 |
| Nov 2014 | 17.48 | 15.46 | 119.45 | 24.07 | 33.03 | 17.16 | 222.91 | 0.87 |
| Dec 2014 | 27.57 | 18.94 | 156.47 | 23.29 | 49.13 | 26.19 | 298.32 | 1.37 |
Download Monthly Gas Data as a CSV file for import into Excel.
Monthly Total Data
| Date | Adj Gas Usage (GJ) | Total Gas Cost ($) | Adj Elec Usage (kWh) | Total Elec Cost ($) | Total Usage (ekWh) | Total Cost ($) | GHG (tCO2e) |
|---|---|---|---|---|---|---|---|
| Jan 2013 | 30.59 | 443.06 | 1,443.53 | 290.64 | 9,942.03 | 733.70 | 1.54 |
| Feb 2013 | 32.74 | 403.80 | 1,122.82 | 0.00 | 10,216.17 | 403.80 | 1.64 |
| Mar 2013 | 23.90 | 319.97 | 1,319.40 | 123.03 | 7,957.48 | 443.00 | 1.21 |
| Apr 2013 | 19.79 | 261.08 | 1,307.04 | 0.00 | 6,804.25 | 261.08 | 1.00 |
| May 2013 | 9.52 | 155.93 | 1,167.32 | 211.90 | 3,810.49 | 367.83 | 0.49 |
| Jun 2013 | 3.81 | 73.46 | 1,045.20 | 0.00 | 2,103.33 | 73.46 | 0.20 |
| Jul 2013 | 2.22 | 56.40 | 1,180.89 | 198.07 | 1,798.88 | 254.46 | 0.13 |
| Aug 2013 | 0.75 | 35.67 | 1,236.35 | 196.08 | 1,443.74 | 231.75 | 0.05 |
| Sep 2013 | 1.25 | 42.67 | 1,471.80 | 35.83 | 1,819.41 | 78.50 | 0.08 |
| Oct 2013 | 8.88 | 136.58 | 1,705.80 | 0.00 | 4,173.08 | 136.58 | 0.47 |
| Nov 2013 | 18.42 | 254.90 | 1,219.03 | 317.06 | 6,336.98 | 571.96 | 0.93 |
| Dec 2013 | 0.00 | 0.00 | 918.51 | 0.00 | 918.51 | 0.00 | 0.01 |
| Jan 2014 | 66.03 | 727.66 | 1,281.10 | 124.82 | 19,623.77 | 852.49 | 3.30 |
| Feb 2014 | 34.22 | 401.68 | 1,253.39 | 0.00 | 10,759.39 | 401.68 | 1.72 |
| Mar 2014 | 27.23 | 329.93 | 1,293.29 | 211.36 | 8,855.80 | 541.29 | 1.37 |
| Apr 2014 | 21.61 | 269.25 | 1,208.08 | 0.00 | 7,212.01 | 269.25 | 1.09 |
| May 2014 | 11.86 | 154.78 | 1,209.48 | 197.50 | 4,503.22 | 352.28 | 0.60 |
| Jun 2014 | 5.77 | 94.28 | 1,155.08 | 0.00 | 2,759.06 | 94.28 | 0.30 |
| Jul 2014 | 0.00 | 0.00 | 1,246.37 | 238.18 | 1,246.37 | 238.18 | 0.01 |
| Aug 2014 | 3.46 | 90.19 | 1,271.51 | 0.00 | 2,231.45 | 90.19 | 0.18 |
| Sep 2014 | 1.86 | 46.54 | 1,236.64 | 212.05 | 1,754.00 | 258.59 | 0.11 |
| Oct 2014 | 15.54 | 70.72 | 1,281.55 | 0.00 | 5,598.32 | 70.72 | 0.79 |
| Nov 2014 | 17.48 | 222.91 | 1,404.94 | 241.27 | 6,260.05 | 464.17 | 0.88 |
| Dec 2014 | 27.57 | 298.32 | 1,336.42 | 0.00 | 8,994.77 | 298.32 | 1.38 |
Download Monthly Total Data as a CSV file for import into Excel.
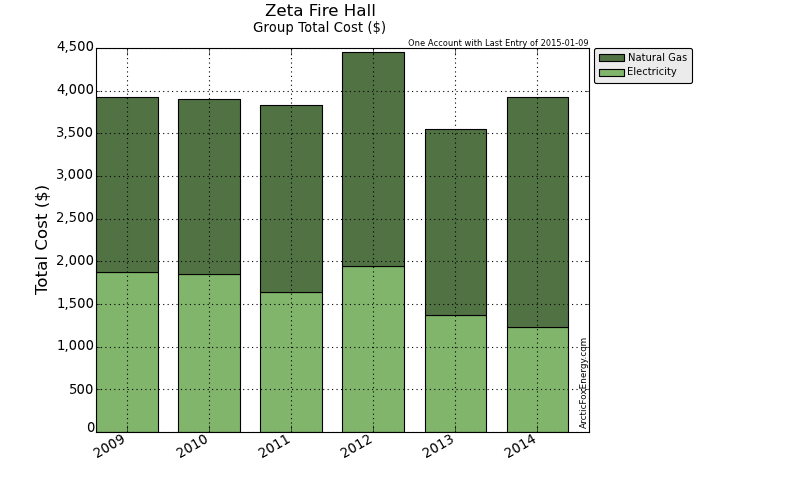
Yearly Data
| Date | Gas Usage (GJ) | Total Gas Cost ($) | Elec Usage (kWh) | Total Elec Cost ($) | Total Usage (ekWh) | Total Cost ($) | GHG (tCO2e) |
|---|---|---|---|---|---|---|---|
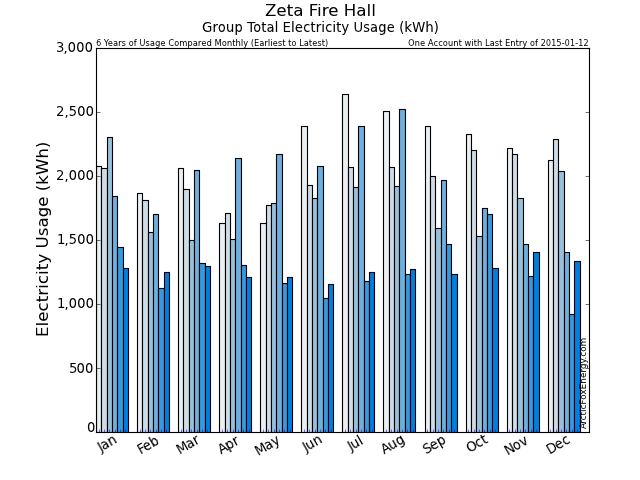
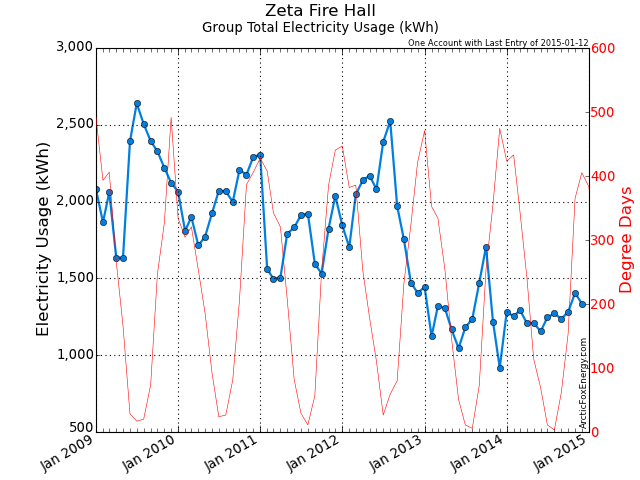
| 2009 | 160.29 | 2,051.38 | 25,875.97 | 1,871.58 | 70,401.10 | 3,922.96 | 8.65 |
| 2010 | 155.86 | 2,046.62 | 23,993.09 | 1,853.54 | 67,288.78 | 3,900.16 | 8.38 |
| 2011 | 157.15 | 2,191.38 | 21,311.84 | 1,635.59 | 64,965.48 | 3,826.97 | 8.35 |
| 2012 | 177.68 | 2,504.56 | 23,498.75 | 1,943.04 | 72,855.68 | 4,447.61 | 9.43 |
| 2013 | 151.87 | 2,183.55 | 15,137.71 | 1,372.60 | 57,324.35 | 3,556.15 | 7.77 |
| 2014 | 232.63 | 2,706.27 | 15,177.86 | 1,225.17 | 79,798.20 | 3,931.44 | 11.73 |
Download Yearly Data as a CSV file for import into Excel.
Metrics
Area Benchmark: - ekWh/sq.m
Hours of Usage per Year: 8760 hours
| Date | Gas Usage per Square Foot (GJ/sq.ft) | Gas Usage per Square Metre (GJ/sq.m) | Elec Usage per Square Foot (kWh/sq.ft) | Elec Usage per Square Metre (kWh/sq.m) |
|---|---|---|---|---|
| 2009 | 0.02 | 0.22 | 3.26 | 35.04 |
| 2010 | 0.02 | 0.21 | 3.02 | 32.49 |
| 2011 | 0.02 | 0.21 | 2.68 | 28.86 |
| 2012 | 0.02 | 0.24 | 2.96 | 31.82 |
| 2013 | 0.02 | 0.21 | 1.90 | 20.50 |
| 2014 | 0.03 | 0.32 | 1.91 | 20.56 |
| Date | Usage per Square Foot (ekWh/sq.ft) | Usage per Square Metre (ekWh/sq.m) | Percent of Benchmark | Usage per Hour (ekWh/h) |
|---|---|---|---|---|
| 2009 | 8.86 | 95.34 | n/a | 8.04 |
| 2010 | 8.47 | 91.13 | n/a | 7.68 |
| 2011 | 8.17 | 87.98 | n/a | 7.42 |
| 2012 | 9.17 | 98.67 | n/a | 8.32 |
| 2013 | 7.21 | 77.63 | n/a | 6.54 |
| 2014 | 10.04 | 108.07 | n/a | 9.11 |
Download Metric Data as a CSV file for import into Excel.
Notes
Please view the Report Notes page for important details about this report.
If any data appears unusual, please contact info@ArcticFoxEnergy.com for a manual verification. If any anomalies are detected, they will be immediately corrected.
