1199 Zeta Ave
Details
Address: 1199 Zeta Ave
Premise #: 667787
Meter: RCT112240
Account Type: FortisBC
Last Entry: 2015-01-09
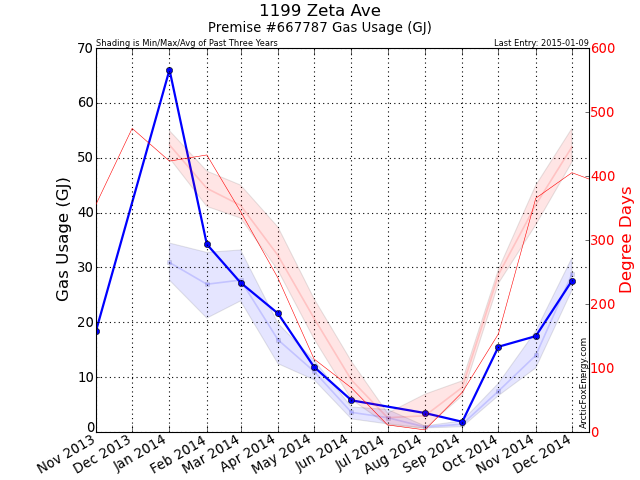
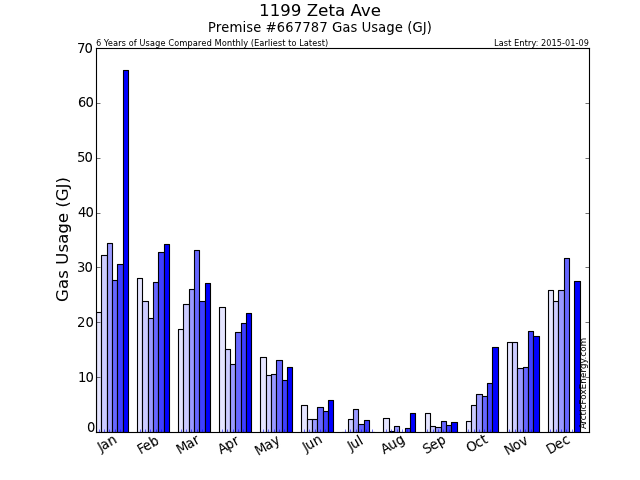
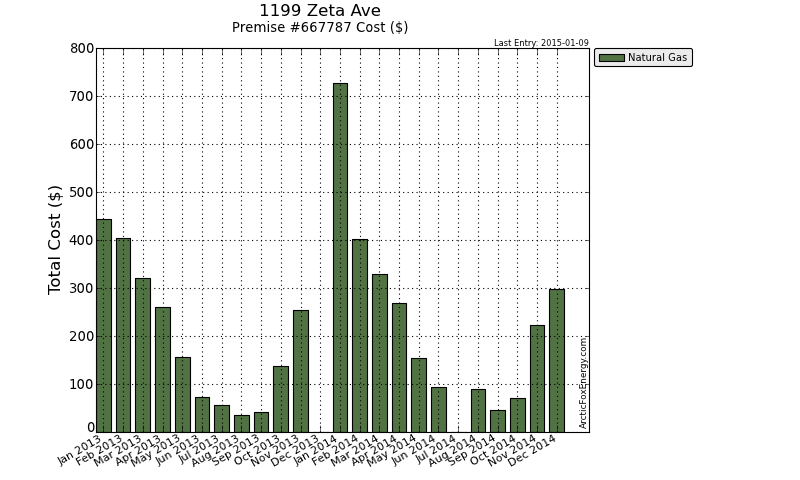
Monthly Data
| Date | Adj Gas Usage (GJ) | Read Usage (GJ) | Gas Cost ($) | Basic / Mgmt Cost ($) | Delivery Cost ($) | Midstream Cost ($) | Total Gas Cost ($) | GHG (tCO2e) |
|---|---|---|---|---|---|---|---|---|
| Jan 2013 | 30.59 | 30.59 | 414.63 | 28.44 | 0.00 | 0.00 | 443.06 | 1.52 |
| Feb 2013 | 32.74 | 32.74 | 378.14 | 25.66 | 0.00 | 0.00 | 403.80 | 1.63 |
| Mar 2013 | 23.90 | 23.90 | 291.81 | 28.17 | 0.00 | 0.00 | 319.97 | 1.19 |
| Apr 2013 | 19.79 | 19.79 | 235.90 | 25.18 | 0.00 | 0.00 | 261.08 | 0.98 |
| May 2013 | 9.52 | 9.52 | 132.36 | 23.57 | 0.00 | 0.00 | 155.93 | 0.47 |
| Jun 2013 | 3.81 | 3.81 | 48.86 | 24.61 | 0.00 | 0.00 | 73.46 | 0.19 |
| Jul 2013 | 2.22 | 2.22 | 27.73 | 28.67 | 0.00 | 0.00 | 56.40 | 0.11 |
| Aug 2013 | 0.75 | 0.75 | 9.79 | 25.88 | 0.00 | 0.00 | 35.67 | 0.04 |
| Sep 2013 | 1.25 | 1.25 | 16.13 | 26.54 | 0.00 | 0.00 | 42.67 | 0.06 |
| Oct 2013 | 8.88 | 8.88 | 112.65 | 23.94 | 0.00 | 0.00 | 136.58 | 0.44 |
| Nov 2013 | 18.42 | 18.42 | 228.37 | 26.53 | 0.00 | 0.00 | 254.90 | 0.92 |
| Dec 2013 | 0.00 | 0.00 | 0.00 | 0.00 | 0.00 | 0.00 | 0.00 | 0.00 |
| Jan 2014 | 66.03 | 64.81 | 680.33 | 47.33 | 0.00 | 0.00 | 727.66 | 3.29 |
| Feb 2014 | 34.22 | 35.44 | 373.34 | 28.34 | 0.00 | 0.00 | 401.68 | 1.70 |
| Mar 2014 | 27.23 | 27.23 | 304.14 | 25.79 | 0.00 | 0.00 | 329.93 | 1.35 |
| Apr 2014 | 21.61 | 21.61 | 242.94 | 26.31 | 0.00 | 0.00 | 269.25 | 1.08 |
| May 2014 | 11.86 | 11.86 | 128.79 | 25.99 | 0.00 | 0.00 | 154.78 | 0.59 |
| Jun 2014 | 5.77 | 5.77 | 65.25 | 29.04 | 0.00 | 0.00 | 94.28 | 0.29 |
| Jul 2014 | 0.00 | 0.00 | 0.00 | 0.00 | 0.00 | 0.00 | 0.00 | 0.00 |
| Aug 2014 | 3.46 | 3.46 | 36.78 | 53.41 | 0.00 | 0.00 | 90.19 | 0.17 |
| Sep 2014 | 1.86 | 1.86 | 23.27 | 23.28 | 0.00 | 0.00 | 46.54 | 0.09 |
| Oct 2014 | 15.54 | 3.95 | 45.52 | 25.20 | 0.00 | 0.00 | 70.72 | 0.77 |
| Nov 2014 | 17.48 | 15.46 | 119.45 | 24.07 | 33.03 | 17.16 | 222.91 | 0.87 |
| Dec 2014 | 27.57 | 18.94 | 156.47 | 23.29 | 49.13 | 26.19 | 298.32 | 1.37 |
Download Monthly Data as a CSV file for import into Excel.
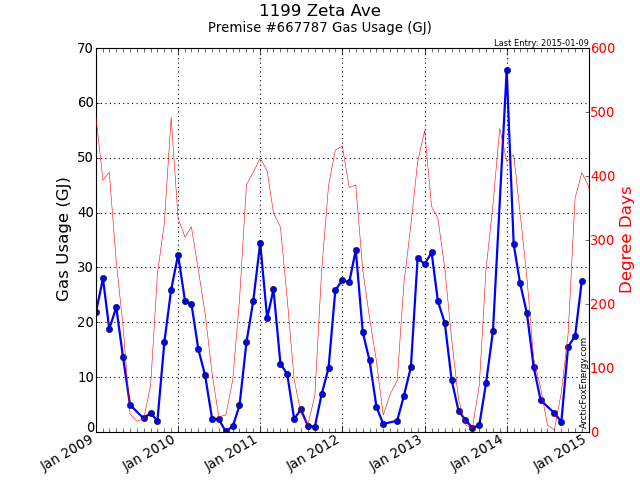
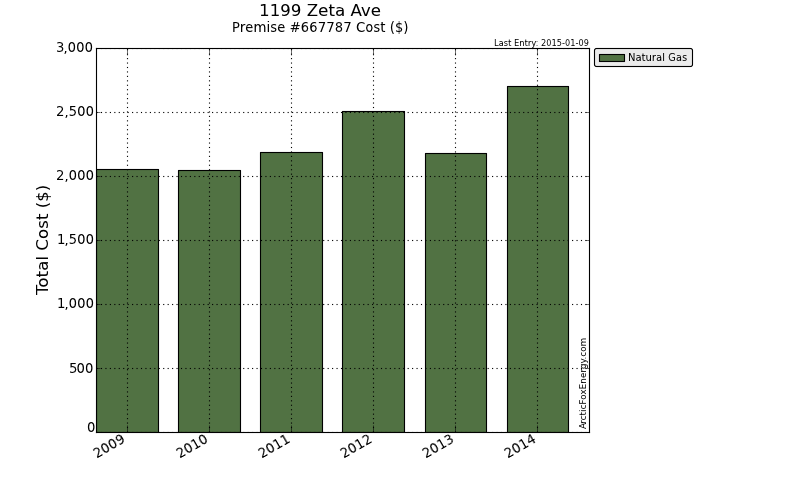
Yearly Data
| Date | Gas Usage (GJ) | Total Gas Cost ($) | GHG (tCO2e) |
|---|---|---|---|
| 2009 | 160.29 | 2,051.38 | 7.97 |
| 2010 | 155.86 | 2,046.62 | 7.75 |
| 2011 | 157.15 | 2,191.38 | 7.82 |
| 2012 | 177.68 | 2,504.56 | 8.84 |
| 2013 | 151.87 | 2,183.55 | 7.56 |
| 2014 | 232.63 | 2,706.27 | 11.57 |
Download Yearly Data as a CSV file for import into Excel.
Notes
Please view the Report Notes page for important details about this report.
If any data appears unusual, please contact info@ArcticFoxEnergy.com for a manual verification. If any anomalies are detected, they will be immediately corrected.