9911 Epsilon Ave
Details
Address: 9911 Epsilon Ave
Premise #: 667786
Meter: RCT112239
Account Type: FortisBC
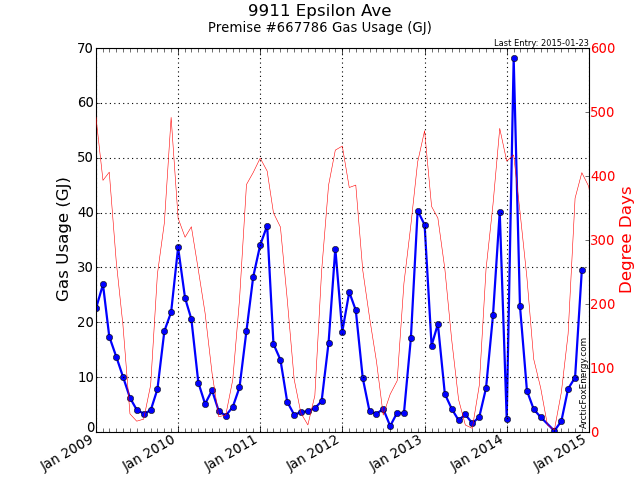
Last Entry: 2015-01-23
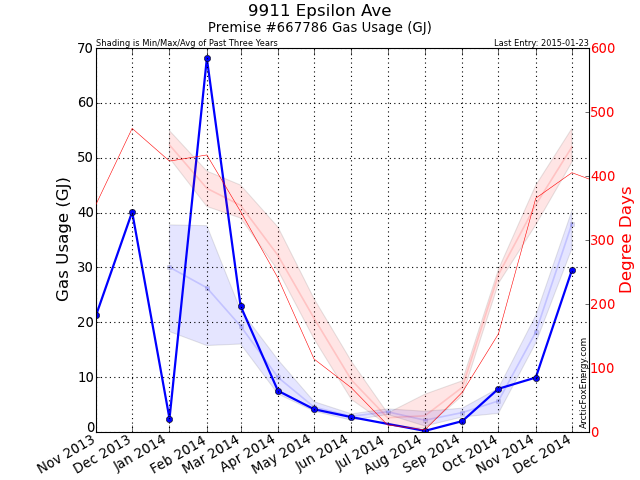
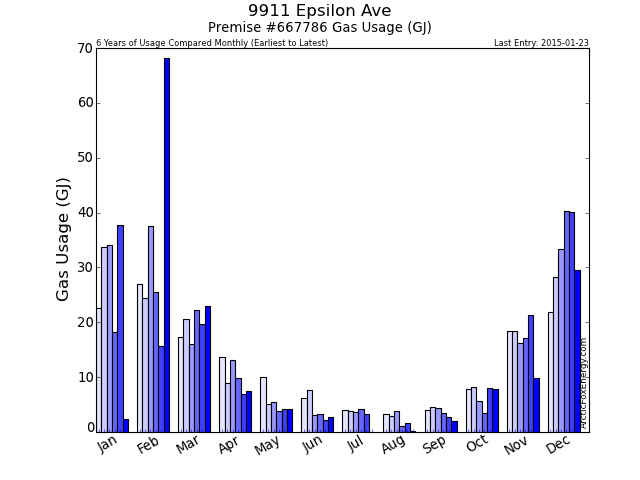
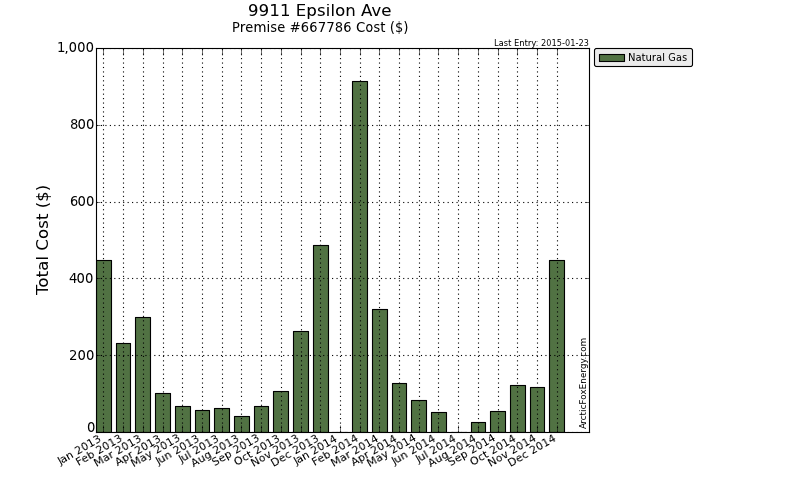
Monthly Data
| Date | Adj Gas Usage (GJ) | Read Usage (GJ) | Gas Cost ($) | Basic / Mgmt Cost ($) | Delivery Cost ($) | Midstream Cost ($) | Total Gas Cost ($) | GHG (tCO2e) |
|---|---|---|---|---|---|---|---|---|
| Jan 2013 | 37.76 | 37.76 | 418.57 | 28.21 | 0.00 | 0.00 | 446.78 | 1.88 |
| Feb 2013 | 15.76 | 15.76 | 206.07 | 26.52 | 0.00 | 0.00 | 232.59 | 0.78 |
| Mar 2013 | 19.69 | 19.69 | 269.21 | 29.03 | 0.00 | 0.00 | 298.24 | 0.98 |
| Apr 2013 | 6.94 | 6.94 | 77.49 | 24.03 | 0.00 | 0.00 | 101.52 | 0.35 |
| May 2013 | 4.27 | 4.27 | 43.42 | 23.16 | 0.00 | 0.00 | 66.58 | 0.21 |
| Jun 2013 | 2.15 | 2.15 | 32.79 | 24.05 | 0.00 | 0.00 | 56.84 | 0.11 |
| Jul 2013 | 3.20 | 3.20 | 37.86 | 23.58 | 0.00 | 0.00 | 61.43 | 0.16 |
| Aug 2013 | 1.59 | 1.59 | 18.48 | 22.80 | 0.00 | 0.00 | 41.28 | 0.08 |
| Sep 2013 | 2.74 | 2.74 | 41.93 | 25.96 | 0.00 | 0.00 | 67.89 | 0.14 |
| Oct 2013 | 7.98 | 7.98 | 82.47 | 23.07 | 0.00 | 0.00 | 105.54 | 0.40 |
| Nov 2013 | 21.25 | 21.25 | 234.69 | 27.96 | 0.00 | 0.00 | 262.65 | 1.06 |
| Dec 2013 | 40.11 | 40.11 | 460.72 | 26.12 | 0.00 | 0.00 | 486.83 | 2.00 |
| Jan 2014 | 2.43 | 0.00 | 0.00 | 0.00 | 0.00 | 0.00 | 0.00 | 0.12 |
| Feb 2014 | 68.11 | 70.54 | 865.92 | 48.86 | 0.00 | 0.00 | 914.77 | 3.39 |
| Mar 2014 | 22.97 | 22.97 | 294.17 | 27.19 | 0.00 | 0.00 | 321.36 | 1.14 |
| Apr 2014 | 7.52 | 7.52 | 101.79 | 25.34 | 0.00 | 0.00 | 127.13 | 0.37 |
| May 2014 | 4.15 | 4.15 | 54.71 | 28.84 | 0.00 | 0.00 | 83.55 | 0.21 |
| Jun 2014 | 2.71 | 2.71 | 29.70 | 23.31 | 0.00 | 0.00 | 53.01 | 0.13 |
| Jul 2014 | 0.00 | 0.00 | 0.00 | 0.00 | 0.00 | 0.00 | 0.00 | 0.00 |
| Aug 2014 | 0.21 | 0.21 | 2.92 | 23.50 | 0.00 | 0.00 | 26.42 | 0.01 |
| Sep 2014 | 1.98 | 1.98 | 26.04 | 27.68 | 0.00 | 0.00 | 53.72 | 0.10 |
| Oct 2014 | 7.88 | 7.09 | 93.81 | 27.97 | 0.00 | 0.00 | 121.78 | 0.39 |
| Nov 2014 | 9.93 | 5.88 | 55.13 | 22.22 | 15.88 | 10.00 | 117.98 | 0.49 |
| Dec 2014 | 29.52 | 32.60 | 230.05 | 21.65 | 75.79 | 49.81 | 448.31 | 1.47 |
Download Monthly Data as a CSV file for import into Excel.
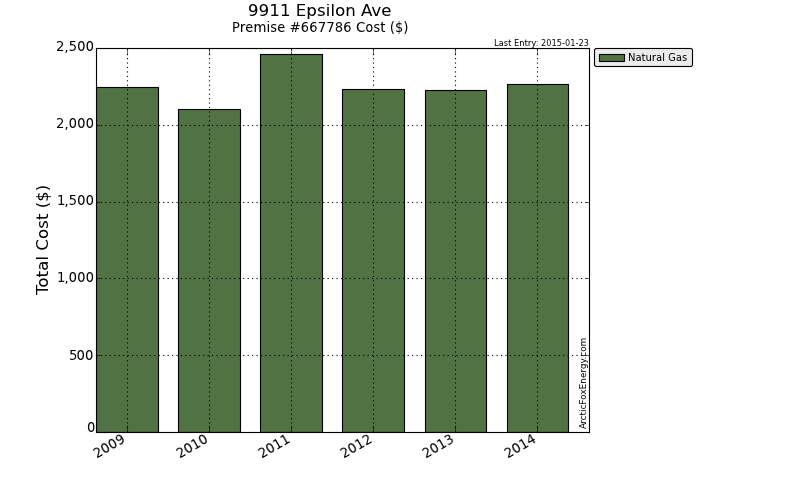
Yearly Data
| Date | Gas Usage (GJ) | Total Gas Cost ($) | GHG (tCO2e) |
|---|---|---|---|
| 2009 | 156.24 | 2,245.36 | 7.77 |
| 2010 | 166.56 | 2,099.87 | 8.29 |
| 2011 | 176.63 | 2,463.40 | 8.79 |
| 2012 | 152.66 | 2,230.42 | 7.59 |
| 2013 | 163.43 | 2,228.20 | 8.13 |
| 2014 | 157.40 | 2,268.04 | 7.83 |
Download Yearly Data as a CSV file for import into Excel.
Notes
Please view the Report Notes page for important details about this report.
If any data appears unusual, please contact info@ArcticFoxEnergy.com for a manual verification. If any anomalies are detected, they will be immediately corrected.