Lambda Library
Details
Name: Lambda Library
Address: 9002 Lambda Ln
Size: 12800 sqft
Year Built: 1965
Floors: 5
Legal Description:
PID:
Monthly Electricity Data
| Date | Adj Elec Usage (kWh) | Read Usage (kWh) | Elec Cost ($) | Demand Cost ($) | PF Cost ($) | Total Elec Cost ($) | GHG (tCO2e) |
|---|---|---|---|---|---|---|---|
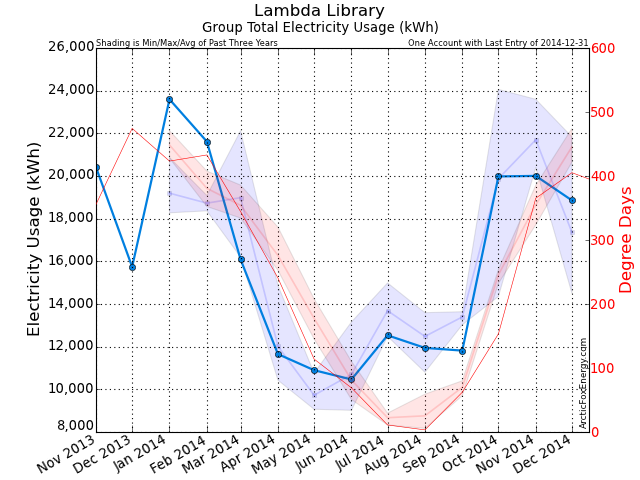
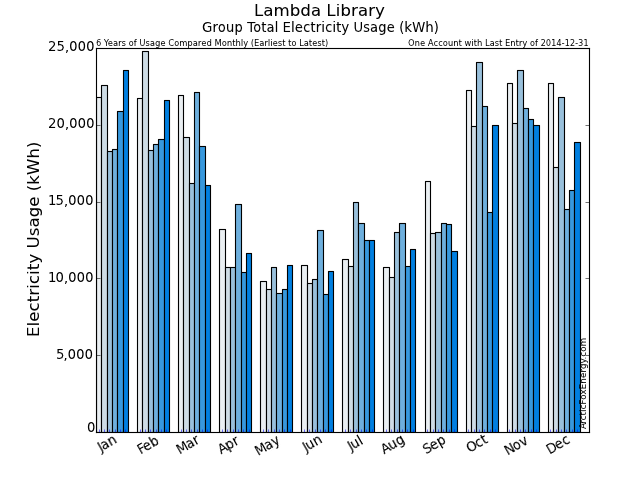
| Jan 2013 | 20,870.03 | 22,889.72 | 1,243.05 | 394.53 | 0.00 | 1,860.06 | 0.29 |
| Feb 2013 | 19,085.40 | 17,830.18 | 918.87 | 275.43 | 0.00 | 1,373.77 | 0.27 |
| Mar 2013 | 18,631.33 | 18,828.31 | 1,223.97 | 241.94 | 0.00 | 1,622.48 | 0.26 |
| Apr 2013 | 10,428.86 | 10,582.37 | 834.05 | 209.75 | 17.93 | 1,203.34 | 0.15 |
| May 2013 | 9,340.32 | 9,951.94 | 773.42 | 223.78 | 93.16 | 1,235.33 | 0.13 |
| Jun 2013 | 9,016.59 | 8,500.17 | 584.16 | 232.97 | 124.71 | 1,068.12 | 0.13 |
| Jul 2013 | 12,480.42 | 12,952.43 | 830.82 | 6.89 | 121.46 | 1,085.86 | 0.17 |
| Aug 2013 | 10,799.51 | 9,787.88 | 807.20 | 6.25 | 109.42 | 1,030.14 | 0.15 |
| Sep 2013 | 13,518.08 | 13,941.09 | 973.99 | 221.26 | 22.23 | 1,372.78 | 0.19 |
| Oct 2013 | 14,355.02 | 0.00 | 0.00 | 0.00 | 0.00 | 0.00 | 0.20 |
| Nov 2013 | 20,408.23 | 35,181.58 | 2,126.42 | 486.18 | 26.69 | 3,012.63 | 0.29 |
| Dec 2013 | 15,741.55 | 16,249.34 | 1,048.51 | 215.81 | 0.00 | 1,436.64 | 0.22 |
| Jan 2014 | 23,594.44 | 22,070.19 | 1,279.85 | 389.91 | 0.00 | 1,871.70 | 0.24 |
| Feb 2014 | 21,615.29 | 22,101.71 | 1,348.40 | 413.46 | 0.00 | 1,970.99 | 0.22 |
| Mar 2014 | 16,086.38 | 17,124.21 | 1,158.53 | 237.22 | 0.00 | 1,547.42 | 0.16 |
| Apr 2014 | 11,650.92 | 0.00 | 0.00 | 0.00 | 0.00 | 0.00 | 0.12 |
| May 2014 | 10,897.63 | 21,863.74 | 1,675.52 | 782.83 | 44.72 | 2,809.01 | 0.11 |
| Jun 2014 | 10,461.71 | 9,929.86 | 759.75 | 353.10 | 42.52 | 1,290.88 | 0.10 |
| Jul 2014 | 12,531.66 | 12,977.82 | 825.66 | 312.53 | 196.32 | 1,508.09 | 0.13 |
| Aug 2014 | 11,942.82 | 0.00 | 0.00 | 0.00 | 0.00 | 0.00 | 0.12 |
| Sep 2014 | 11,815.29 | 23,885.64 | 1,821.00 | 813.29 | 237.34 | 3,216.79 | 0.12 |
| Oct 2014 | 19,980.03 | 19,289.34 | 1,469.78 | 416.69 | -0.79 | 2,054.70 | 0.20 |
| Nov 2014 | 20,005.05 | 0.00 | 0.00 | 0.00 | 0.00 | 0.00 | 0.20 |
| Dec 2014 | 18,857.12 | 40,195.84 | 3,297.58 | 0.00 | 0.00 | 3,799.74 | 0.19 |
Download Monthly Electricity Data as a CSV file for import into Excel.
Monthly Gas Data
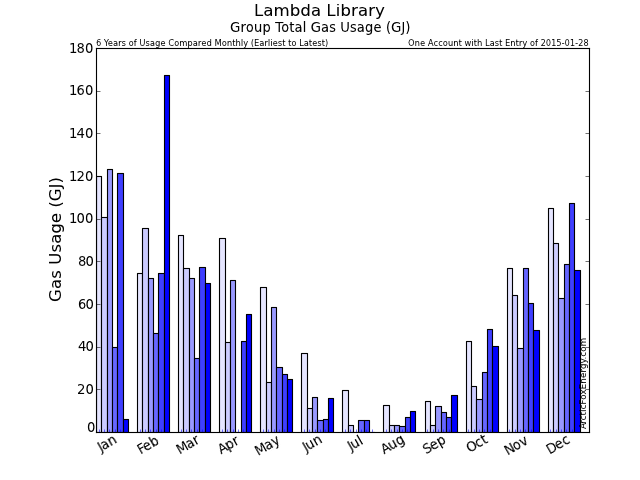
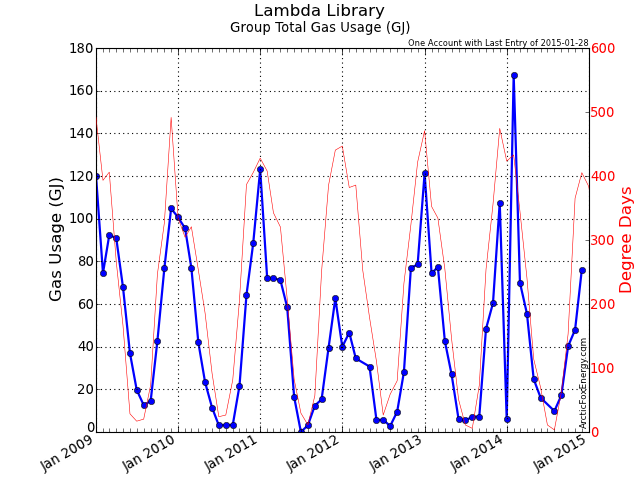
| Date | Adj Gas Usage (GJ) | Read Usage (GJ) | Gas Cost ($) | Basic / Mgmt Cost ($) | Delivery Cost ($) | Midstream Cost ($) | Total Gas Cost ($) | GHG (tCO2e) |
|---|---|---|---|---|---|---|---|---|
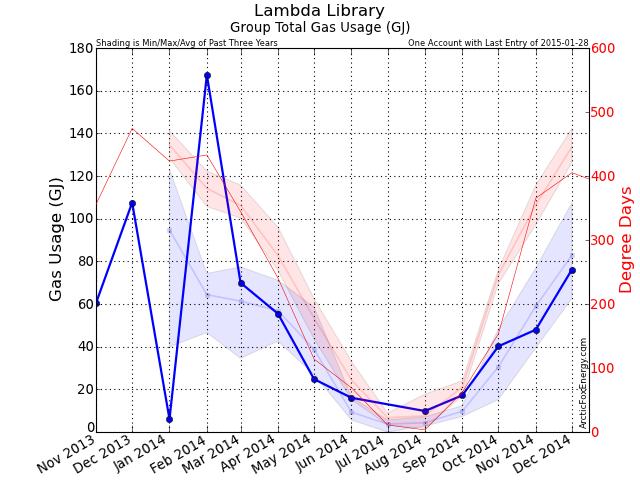
| Jan 2013 | 121.27 | 121.27 | 1,250.82 | 22.95 | 0.00 | 0.00 | 1,273.78 | 6.03 |
| Feb 2013 | 74.35 | 74.35 | 817.93 | 28.00 | 0.00 | 0.00 | 845.93 | 3.70 |
| Mar 2013 | 77.41 | 77.41 | 818.00 | 23.98 | 0.00 | 0.00 | 841.98 | 3.85 |
| Apr 2013 | 42.61 | 42.61 | 665.48 | 28.19 | 0.00 | 0.00 | 693.67 | 2.12 |
| May 2013 | 26.96 | 26.96 | 338.63 | 27.44 | 0.00 | 0.00 | 366.07 | 1.34 |
| Jun 2013 | 5.99 | 5.99 | 80.97 | 27.92 | 0.00 | 0.00 | 108.89 | 0.30 |
| Jul 2013 | 5.41 | 5.41 | 67.38 | 26.92 | 0.00 | 0.00 | 94.30 | 0.27 |
| Aug 2013 | 7.12 | 7.12 | 86.59 | 25.45 | 0.00 | 0.00 | 112.04 | 0.35 |
| Sep 2013 | 7.26 | 7.26 | 104.16 | 27.49 | 0.00 | 0.00 | 131.65 | 0.36 |
| Oct 2013 | 48.37 | 48.37 | 588.93 | 24.65 | 0.00 | 0.00 | 613.58 | 2.41 |
| Nov 2013 | 60.40 | 60.40 | 835.63 | 27.84 | 0.00 | 0.00 | 863.47 | 3.00 |
| Dec 2013 | 107.52 | 107.52 | 1,317.97 | 26.43 | 0.00 | 0.00 | 1,344.40 | 5.35 |
| Jan 2014 | 5.98 | 0.00 | 0.00 | 0.00 | 0.00 | 0.00 | 0.00 | 0.30 |
| Feb 2014 | 167.40 | 173.38 | 1,889.55 | 49.97 | 0.00 | 0.00 | 1,939.52 | 8.33 |
| Mar 2014 | 69.92 | 69.92 | 855.80 | 23.06 | 0.00 | 0.00 | 878.86 | 3.48 |
| Apr 2014 | 55.46 | 55.46 | 669.50 | 29.21 | 0.00 | 0.00 | 698.71 | 2.76 |
| May 2014 | 24.77 | 24.77 | 295.91 | 26.72 | 0.00 | 0.00 | 322.64 | 1.23 |
| Jun 2014 | 16.04 | 16.04 | 196.47 | 23.37 | 0.00 | 0.00 | 219.84 | 0.80 |
| Jul 2014 | 0.00 | 0.00 | 0.00 | 0.00 | 0.00 | 0.00 | 0.00 | 0.00 |
| Aug 2014 | 9.83 | 9.83 | 138.74 | 26.89 | 0.00 | 0.00 | 165.63 | 0.49 |
| Sep 2014 | 17.19 | 17.19 | 233.05 | 24.52 | 0.00 | 0.00 | 257.57 | 0.86 |
| Oct 2014 | 40.19 | 35.58 | 547.33 | 25.33 | 0.00 | 0.00 | 572.66 | 2.00 |
| Nov 2014 | 47.95 | 47.65 | 361.71 | 24.20 | 131.28 | 74.60 | 698.84 | 2.39 |
| Dec 2014 | 76.15 | 0.00 | 813.97 | 20.85 | 243.47 | 128.86 | 1,428.50 | 3.79 |
Download Monthly Gas Data as a CSV file for import into Excel.
Monthly Total Data
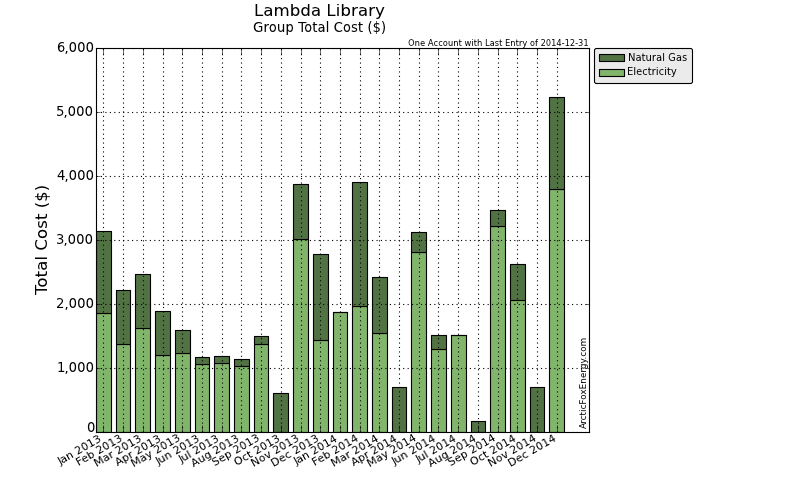
| Date | Adj Gas Usage (GJ) | Total Gas Cost ($) | Adj Elec Usage (kWh) | Total Elec Cost ($) | Total Usage (ekWh) | Total Cost ($) | GHG (tCO2e) |
|---|---|---|---|---|---|---|---|
| Jan 2013 | 121.27 | 1,273.78 | 20,870.03 | 1,860.06 | 54,555.76 | 3,133.83 | 6.33 |
| Feb 2013 | 74.35 | 845.93 | 19,085.40 | 1,373.77 | 39,738.29 | 2,219.70 | 3.97 |
| Mar 2013 | 77.41 | 841.98 | 18,631.33 | 1,622.48 | 40,133.56 | 2,464.46 | 4.11 |
| Apr 2013 | 42.61 | 693.67 | 10,428.86 | 1,203.34 | 22,265.16 | 1,897.00 | 2.27 |
| May 2013 | 26.96 | 366.07 | 9,340.32 | 1,235.33 | 16,828.54 | 1,601.41 | 1.47 |
| Jun 2013 | 5.99 | 108.89 | 9,016.59 | 1,068.12 | 10,681.83 | 1,177.01 | 0.42 |
| Jul 2013 | 5.41 | 94.30 | 12,480.42 | 1,085.86 | 13,982.28 | 1,180.16 | 0.44 |
| Aug 2013 | 7.12 | 112.04 | 10,799.51 | 1,030.14 | 12,776.58 | 1,142.19 | 0.51 |
| Sep 2013 | 7.26 | 131.65 | 13,518.08 | 1,372.78 | 15,534.07 | 1,504.42 | 0.55 |
| Oct 2013 | 48.37 | 613.58 | 14,355.02 | 0.00 | 27,791.55 | 613.58 | 2.61 |
| Nov 2013 | 60.40 | 863.47 | 20,408.23 | 3,012.63 | 37,185.12 | 3,876.10 | 3.29 |
| Dec 2013 | 107.52 | 1,344.40 | 15,741.55 | 1,436.64 | 45,609.31 | 2,781.04 | 5.57 |
| Jan 2014 | 5.98 | 0.00 | 23,594.44 | 1,871.70 | 25,255.19 | 1,871.70 | 0.53 |
| Feb 2014 | 167.40 | 1,939.52 | 21,615.29 | 1,970.99 | 68,116.30 | 3,910.51 | 8.54 |
| Mar 2014 | 69.92 | 878.86 | 16,086.38 | 1,547.42 | 35,509.35 | 2,426.29 | 3.64 |
| Apr 2014 | 55.46 | 698.71 | 11,650.92 | 0.00 | 27,056.89 | 698.71 | 2.88 |
| May 2014 | 24.77 | 322.64 | 10,897.63 | 2,809.01 | 17,777.90 | 3,131.64 | 1.34 |
| Jun 2014 | 16.04 | 219.84 | 10,461.71 | 1,290.88 | 14,916.31 | 1,510.72 | 0.90 |
| Jul 2014 | 0.00 | 0.00 | 12,531.66 | 1,508.09 | 12,531.66 | 1,508.09 | 0.13 |
| Aug 2014 | 9.83 | 165.63 | 11,942.82 | 0.00 | 14,672.56 | 165.63 | 0.61 |
| Sep 2014 | 17.19 | 257.57 | 11,815.29 | 3,216.79 | 16,589.93 | 3,474.35 | 0.97 |
| Oct 2014 | 40.19 | 572.66 | 19,980.03 | 2,054.70 | 31,143.90 | 2,627.36 | 2.20 |
| Nov 2014 | 47.95 | 698.84 | 20,005.05 | 0.00 | 33,324.83 | 698.84 | 2.59 |
| Dec 2014 | 76.15 | 1,428.50 | 18,857.12 | 3,799.74 | 40,009.07 | 5,228.24 | 3.98 |
Download Monthly Total Data as a CSV file for import into Excel.
Yearly Data
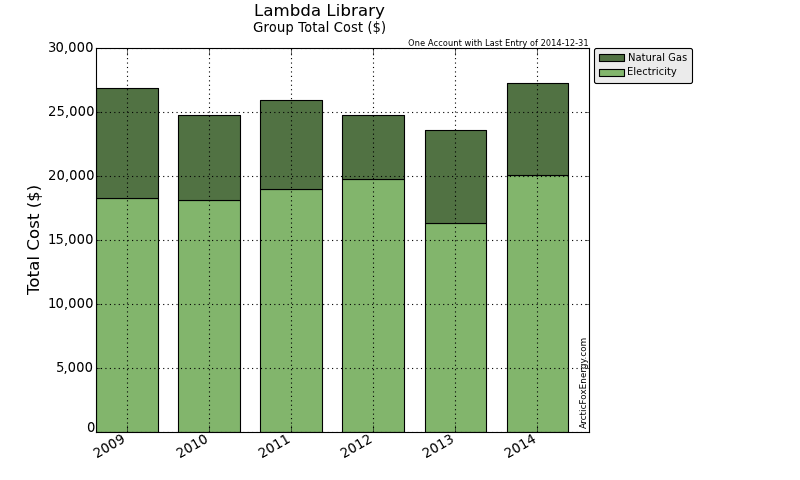
| Date | Gas Usage (GJ) | Total Gas Cost ($) | Elec Usage (kWh) | Total Elec Cost ($) | Total Usage (ekWh) | Total Cost ($) | GHG (tCO2e) |
|---|---|---|---|---|---|---|---|
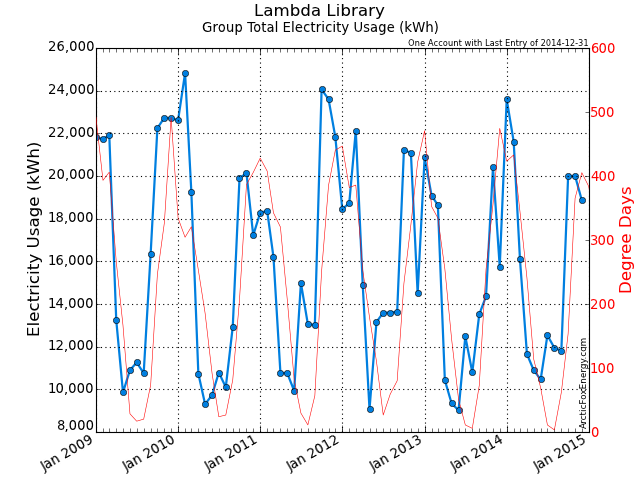
| 2009 | 753.78 | 8,606.64 | 205,531.59 | 18,286.16 | 414,914.62 | 26,892.80 | 42.84 |
| 2010 | 533.79 | 6,576.49 | 187,518.38 | 18,154.26 | 335,794.51 | 24,730.75 | 31.43 |
| 2011 | 546.34 | 6,928.54 | 194,846.35 | 18,972.13 | 346,606.59 | 25,900.66 | 32.05 |
| 2012 | 358.89 | 5,028.07 | 194,014.74 | 19,740.29 | 293,707.63 | 24,768.37 | 22.71 |
| 2013 | 584.66 | 7,289.75 | 174,675.34 | 16,301.16 | 337,082.06 | 23,590.91 | 31.53 |
| 2014 | 530.88 | 7,182.77 | 189,438.33 | 20,069.32 | 336,903.89 | 27,252.09 | 28.31 |
Download Yearly Data as a CSV file for import into Excel.
Metrics
Area Benchmark: - ekWh/sq.m
Hours of Usage per Year: 8760 hours
| Date | Gas Usage per Square Foot (GJ/sq.ft) | Gas Usage per Square Metre (GJ/sq.m) | Elec Usage per Square Foot (kWh/sq.ft) | Elec Usage per Square Metre (kWh/sq.m) |
|---|---|---|---|---|
| 2009 | 0.06 | 0.63 | 16.06 | 172.84 |
| 2010 | 0.04 | 0.45 | 14.65 | 157.69 |
| 2011 | 0.04 | 0.46 | 15.22 | 163.85 |
| 2012 | 0.03 | 0.30 | 15.16 | 163.15 |
| 2013 | 0.05 | 0.49 | 13.65 | 146.89 |
| 2014 | 0.04 | 0.45 | 14.80 | 159.30 |
| Date | Usage per Square Foot (ekWh/sq.ft) | Usage per Square Metre (ekWh/sq.m) | Percent of Benchmark | Usage per Hour (ekWh/h) |
|---|---|---|---|---|
| 2009 | 32.42 | 348.91 | n/a | 47.36 |
| 2010 | 26.23 | 282.38 | n/a | 38.33 |
| 2011 | 27.08 | 291.47 | n/a | 39.57 |
| 2012 | 22.95 | 246.99 | n/a | 33.53 |
| 2013 | 26.33 | 283.46 | n/a | 38.48 |
| 2014 | 26.32 | 283.31 | n/a | 38.46 |
Download Metric Data as a CSV file for import into Excel.
Notes
Please view the Report Notes page for important details about this report.
If any data appears unusual, please contact info@ArcticFoxEnergy.com for a manual verification. If any anomalies are detected, they will be immediately corrected.
