Iota Library
Details
Name: Iota Library
Address: 4412 Reading Rd
Size: 7388 sqft
Year Built: 1997
Floors: 1
Legal Description:
PID:
Monthly Electricity Data
| Date | Adj Elec Usage (kWh) | Read Usage (kWh) | Elec Cost ($) | Demand Cost ($) | PF Cost ($) | Total Elec Cost ($) | GHG (tCO2e) |
|---|---|---|---|---|---|---|---|
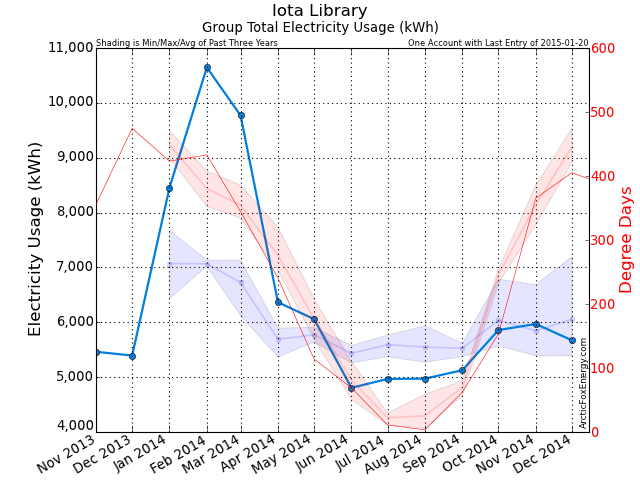
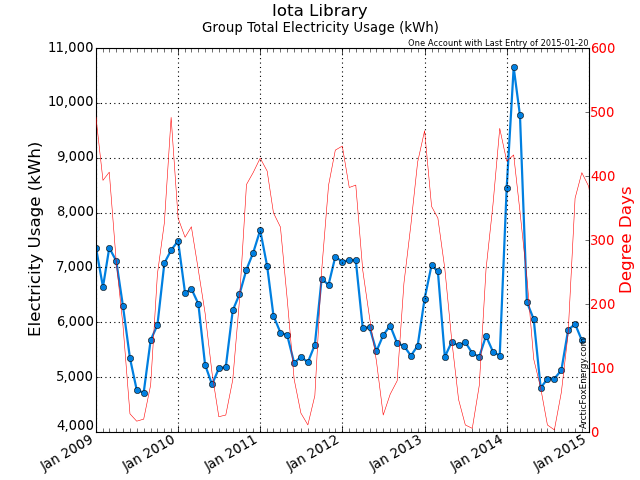
| Jan 2013 | 6,431.78 | 21,921.29 | 1,707.87 | 0.00 | 0.00 | 1,917.60 | 0.09 |
| Feb 2013 | 7,041.56 | 0.00 | 0.00 | 0.00 | 0.00 | 0.00 | 0.10 |
| Mar 2013 | 6,925.99 | 14,837.58 | 866.82 | 0.00 | 0.00 | 998.82 | 0.10 |
| Apr 2013 | 5,369.46 | 0.00 | 0.00 | 0.00 | 0.00 | 0.00 | 0.08 |
| May 2013 | 5,638.51 | 10,738.93 | 712.13 | 0.00 | 0.00 | 821.41 | 0.08 |
| Jun 2013 | 5,577.30 | 0.00 | 0.00 | 0.00 | 0.00 | 0.00 | 0.08 |
| Jul 2013 | 5,636.75 | 11,526.42 | 672.66 | 0.00 | 0.00 | 772.10 | 0.08 |
| Aug 2013 | 5,436.51 | 0.00 | 0.00 | 0.00 | 0.00 | 0.00 | 0.08 |
| Sep 2013 | 5,372.84 | 10,873.03 | 696.00 | 0.00 | 0.00 | 776.94 | 0.08 |
| Oct 2013 | 5,751.31 | 0.00 | 0.00 | 0.00 | 0.00 | 0.00 | 0.08 |
| Nov 2013 | 5,461.98 | 11,688.15 | 823.34 | 0.00 | 0.00 | 941.67 | 0.08 |
| Dec 2013 | 5,393.75 | 0.00 | 0.00 | 0.00 | 0.00 | 0.00 | 0.08 |
| Jan 2014 | 8,454.57 | 10,091.54 | 990.72 | 0.00 | 0.00 | 1,090.93 | 0.08 |
| Feb 2014 | 10,645.43 | 0.00 | 0.00 | 0.00 | 0.00 | 0.00 | 0.11 |
| Mar 2014 | 9,769.88 | 23,191.84 | 1,743.69 | 0.00 | 0.00 | 1,933.39 | 0.10 |
| Apr 2014 | 6,365.47 | 0.00 | 0.00 | 0.00 | 0.00 | 0.00 | 0.06 |
| May 2014 | 6,057.53 | 13,367.50 | 863.31 | 0.00 | 0.00 | 973.66 | 0.06 |
| Jun 2014 | 4,805.08 | 0.00 | 0.00 | 0.00 | 0.00 | 0.00 | 0.05 |
| Jul 2014 | 4,967.52 | 9,770.34 | 829.49 | 0.00 | 0.00 | 925.81 | 0.05 |
| Aug 2014 | 4,972.29 | 0.00 | 0.00 | 0.00 | 0.00 | 0.00 | 0.05 |
| Sep 2014 | 5,126.25 | 9,623.79 | 615.77 | 0.00 | 0.00 | 699.70 | 0.05 |
| Oct 2014 | 5,858.21 | 0.00 | 0.00 | 0.00 | 0.00 | 0.00 | 0.06 |
| Nov 2014 | 5,968.92 | 11,527.44 | 967.04 | 0.00 | 0.00 | 1,076.69 | 0.06 |
| Dec 2014 | 5,671.59 | 0.00 | 0.00 | 0.00 | 0.00 | 0.00 | 0.06 |
Download Monthly Electricity Data as a CSV file for import into Excel.
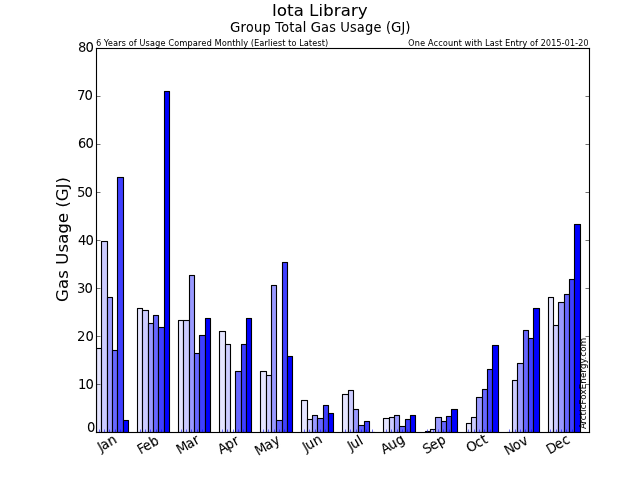
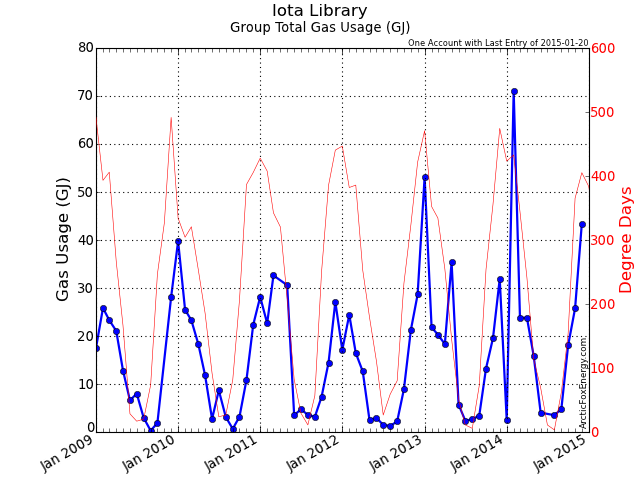
Monthly Gas Data
| Date | Adj Gas Usage (GJ) | Read Usage (GJ) | Gas Cost ($) | Basic / Mgmt Cost ($) | Delivery Cost ($) | Midstream Cost ($) | Total Gas Cost ($) | GHG (tCO2e) |
|---|---|---|---|---|---|---|---|---|
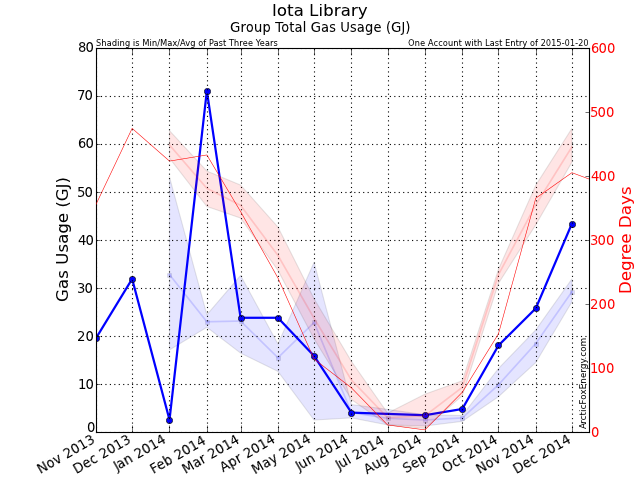
| Jan 2013 | 53.11 | 53.11 | 605.93 | 23.09 | 0.00 | 0.00 | 629.02 | 2.64 |
| Feb 2013 | 21.82 | 21.82 | 263.69 | 27.33 | 0.00 | 0.00 | 291.02 | 1.09 |
| Mar 2013 | 20.28 | 20.28 | 254.11 | 27.90 | 0.00 | 0.00 | 282.02 | 1.01 |
| Apr 2013 | 18.33 | 18.33 | 211.14 | 26.09 | 0.00 | 0.00 | 237.23 | 0.91 |
| May 2013 | 35.37 | 35.37 | 509.24 | 28.90 | 0.00 | 0.00 | 538.14 | 1.76 |
| Jun 2013 | 5.71 | 5.71 | 58.31 | 28.99 | 0.00 | 0.00 | 87.30 | 0.28 |
| Jul 2013 | 2.36 | 2.36 | 30.58 | 27.27 | 0.00 | 0.00 | 57.85 | 0.12 |
| Aug 2013 | 2.65 | 2.65 | 31.64 | 24.50 | 0.00 | 0.00 | 56.14 | 0.13 |
| Sep 2013 | 3.44 | 3.44 | 37.27 | 28.72 | 0.00 | 0.00 | 65.99 | 0.17 |
| Oct 2013 | 13.22 | 13.22 | 164.88 | 25.50 | 0.00 | 0.00 | 190.37 | 0.66 |
| Nov 2013 | 19.55 | 19.55 | 265.87 | 26.45 | 0.00 | 0.00 | 292.32 | 0.97 |
| Dec 2013 | 31.89 | 31.89 | 361.08 | 27.64 | 0.00 | 0.00 | 388.72 | 1.59 |
| Jan 2014 | 2.54 | 0.00 | 0.00 | 0.00 | 0.00 | 0.00 | 0.00 | 0.13 |
| Feb 2014 | 71.07 | 73.61 | 971.64 | 48.50 | 0.00 | 0.00 | 1,020.14 | 3.54 |
| Mar 2014 | 23.79 | 23.79 | 305.26 | 28.59 | 0.00 | 0.00 | 333.85 | 1.18 |
| Apr 2014 | 23.80 | 23.80 | 319.37 | 23.42 | 0.00 | 0.00 | 342.79 | 1.18 |
| May 2014 | 15.85 | 15.85 | 198.86 | 27.92 | 0.00 | 0.00 | 226.78 | 0.79 |
| Jun 2014 | 4.04 | 4.04 | 49.16 | 29.34 | 0.00 | 0.00 | 78.50 | 0.20 |
| Jul 2014 | 0.00 | 0.00 | 0.00 | 0.00 | 0.00 | 0.00 | 0.00 | 0.00 |
| Aug 2014 | 3.50 | 3.50 | 48.27 | 26.85 | 0.00 | 0.00 | 75.12 | 0.17 |
| Sep 2014 | 4.79 | 4.79 | 53.79 | 26.34 | 0.00 | 0.00 | 80.13 | 0.24 |
| Oct 2014 | 18.02 | 9.74 | 127.41 | 26.17 | 0.00 | 0.00 | 153.58 | 0.90 |
| Nov 2014 | 25.76 | 22.58 | 166.00 | 23.67 | 58.99 | 31.12 | 325.11 | 1.28 |
| Dec 2014 | 43.41 | 29.17 | 206.88 | 21.93 | 76.83 | 40.62 | 410.43 | 2.16 |
Download Monthly Gas Data as a CSV file for import into Excel.
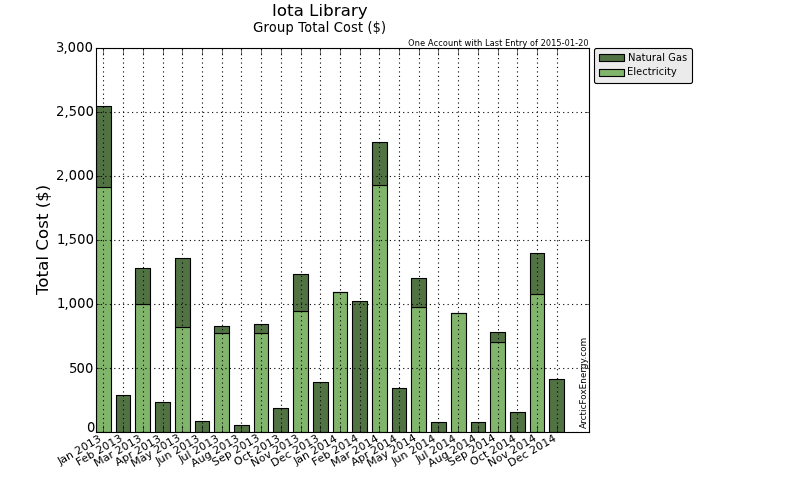
Monthly Total Data
| Date | Adj Gas Usage (GJ) | Total Gas Cost ($) | Adj Elec Usage (kWh) | Total Elec Cost ($) | Total Usage (ekWh) | Total Cost ($) | GHG (tCO2e) |
|---|---|---|---|---|---|---|---|
| Jan 2013 | 53.11 | 629.02 | 6,431.78 | 1,917.60 | 21,183.83 | 2,546.63 | 2.73 |
| Feb 2013 | 21.82 | 291.02 | 7,041.56 | 0.00 | 13,102.76 | 291.02 | 1.18 |
| Mar 2013 | 20.28 | 282.02 | 6,925.99 | 998.82 | 12,558.77 | 1,280.84 | 1.11 |
| Apr 2013 | 18.33 | 237.23 | 5,369.46 | 0.00 | 10,460.16 | 237.23 | 0.99 |
| May 2013 | 35.37 | 538.14 | 5,638.51 | 821.41 | 15,463.73 | 1,359.55 | 1.84 |
| Jun 2013 | 5.71 | 87.30 | 5,577.30 | 0.00 | 7,164.68 | 87.30 | 0.36 |
| Jul 2013 | 2.36 | 57.85 | 5,636.75 | 772.10 | 6,290.94 | 829.95 | 0.20 |
| Aug 2013 | 2.65 | 56.14 | 5,436.51 | 0.00 | 6,173.18 | 56.14 | 0.21 |
| Sep 2013 | 3.44 | 65.99 | 5,372.84 | 776.94 | 6,327.33 | 842.94 | 0.25 |
| Oct 2013 | 13.22 | 190.37 | 5,751.31 | 0.00 | 9,422.89 | 190.37 | 0.74 |
| Nov 2013 | 19.55 | 292.32 | 5,461.98 | 941.67 | 10,891.67 | 1,233.99 | 1.05 |
| Dec 2013 | 31.89 | 388.72 | 5,393.75 | 0.00 | 14,252.09 | 388.72 | 1.66 |
| Jan 2014 | 2.54 | 0.00 | 8,454.57 | 1,090.93 | 9,159.63 | 1,090.93 | 0.21 |
| Feb 2014 | 71.07 | 1,020.14 | 10,645.43 | 0.00 | 30,387.15 | 1,020.14 | 3.64 |
| Mar 2014 | 23.79 | 333.85 | 9,769.88 | 1,933.39 | 16,378.90 | 2,267.24 | 1.28 |
| Apr 2014 | 23.80 | 342.79 | 6,365.47 | 0.00 | 12,975.75 | 342.79 | 1.25 |
| May 2014 | 15.85 | 226.78 | 6,057.53 | 973.66 | 10,459.07 | 1,200.44 | 0.85 |
| Jun 2014 | 4.04 | 78.50 | 4,805.08 | 0.00 | 5,926.06 | 78.50 | 0.25 |
| Jul 2014 | 0.00 | 0.00 | 4,967.52 | 925.81 | 4,967.52 | 925.81 | 0.05 |
| Aug 2014 | 3.50 | 75.12 | 4,972.29 | 0.00 | 5,943.91 | 75.12 | 0.22 |
| Sep 2014 | 4.79 | 80.13 | 5,126.25 | 699.70 | 6,458.07 | 779.83 | 0.29 |
| Oct 2014 | 18.02 | 153.58 | 5,858.21 | 0.00 | 10,864.07 | 153.58 | 0.96 |
| Nov 2014 | 25.76 | 325.11 | 5,968.92 | 1,076.69 | 13,123.90 | 1,401.81 | 1.34 |
| Dec 2014 | 43.41 | 410.43 | 5,671.59 | 0.00 | 17,730.99 | 410.43 | 2.22 |
Download Monthly Total Data as a CSV file for import into Excel.
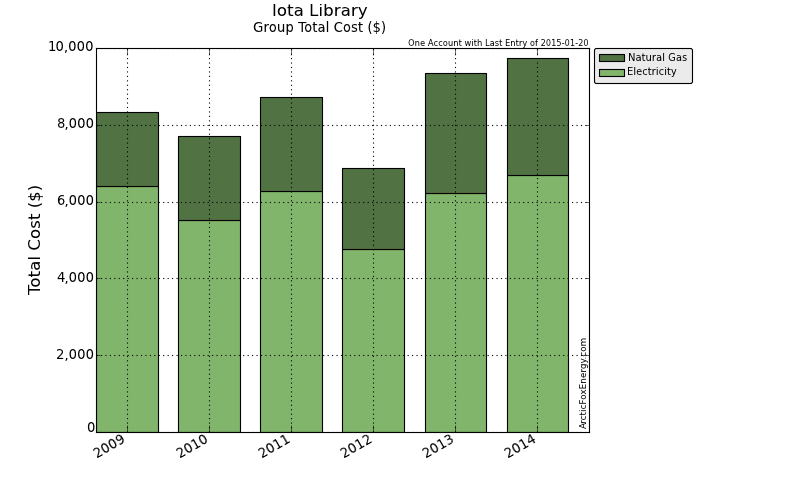
Yearly Data
| Date | Gas Usage (GJ) | Total Gas Cost ($) | Elec Usage (kWh) | Total Elec Cost ($) | Total Usage (ekWh) | Total Cost ($) | GHG (tCO2e) |
|---|---|---|---|---|---|---|---|
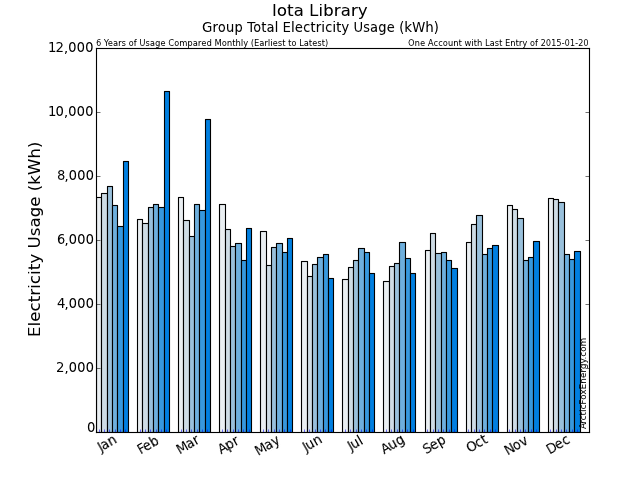
| 2009 | 148.31 | 1,933.74 | 75,617.44 | 6,410.26 | 116,813.97 | 8,344.00 | 9.34 |
| 2010 | 170.17 | 2,187.82 | 74,357.44 | 5,530.02 | 121,627.09 | 7,717.84 | 10.40 |
| 2011 | 177.91 | 2,446.01 | 74,557.47 | 6,283.70 | 123,975.87 | 8,729.71 | 10.71 |
| 2012 | 139.83 | 2,117.67 | 72,493.47 | 4,754.87 | 111,336.18 | 6,872.55 | 8.77 |
| 2013 | 227.72 | 3,116.11 | 70,037.75 | 6,228.54 | 133,292.02 | 9,344.66 | 12.31 |
| 2014 | 236.56 | 3,046.43 | 78,662.75 | 6,700.18 | 144,375.03 | 9,746.61 | 12.56 |
Download Yearly Data as a CSV file for import into Excel.
Metrics
Area Benchmark: - ekWh/sq.m
Hours of Usage per Year: 8760 hours
| Date | Gas Usage per Square Foot (GJ/sq.ft) | Gas Usage per Square Metre (GJ/sq.m) | Elec Usage per Square Foot (kWh/sq.ft) | Elec Usage per Square Metre (kWh/sq.m) |
|---|---|---|---|---|
| 2009 | 0.02 | 0.22 | 10.24 | 110.17 |
| 2010 | 0.02 | 0.25 | 10.06 | 108.33 |
| 2011 | 0.02 | 0.26 | 10.09 | 108.63 |
| 2012 | 0.02 | 0.20 | 9.81 | 105.62 |
| 2013 | 0.03 | 0.33 | 9.48 | 102.04 |
| 2014 | 0.03 | 0.34 | 10.65 | 114.61 |
| Date | Usage per Square Foot (ekWh/sq.ft) | Usage per Square Metre (ekWh/sq.m) | Percent of Benchmark | Usage per Hour (ekWh/h) |
|---|---|---|---|---|
| 2009 | 15.81 | 170.19 | n/a | 13.33 |
| 2010 | 16.46 | 177.20 | n/a | 13.88 |
| 2011 | 16.78 | 180.63 | n/a | 14.15 |
| 2012 | 15.07 | 162.21 | n/a | 12.71 |
| 2013 | 18.04 | 194.20 | n/a | 15.22 |
| 2014 | 19.54 | 210.35 | n/a | 16.48 |
Download Metric Data as a CSV file for import into Excel.
Notes
Please view the Report Notes page for important details about this report.
If any data appears unusual, please contact info@ArcticFoxEnergy.com for a manual verification. If any anomalies are detected, they will be immediately corrected.
