9911 Epsilon Ave
Details
Address: 9911 Epsilon Ave
Account #: 1985283929
Account Type: BC Hydro
Last Entry: 2015-01-26
Monthly Data
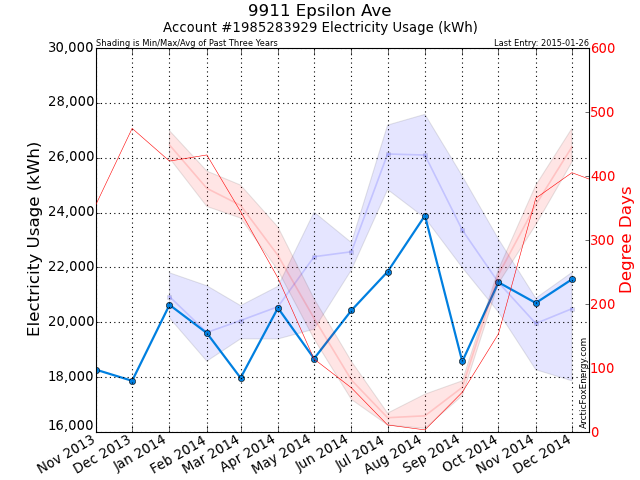
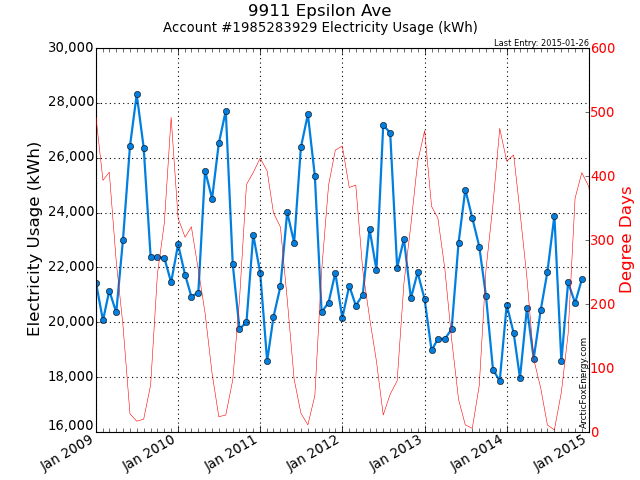
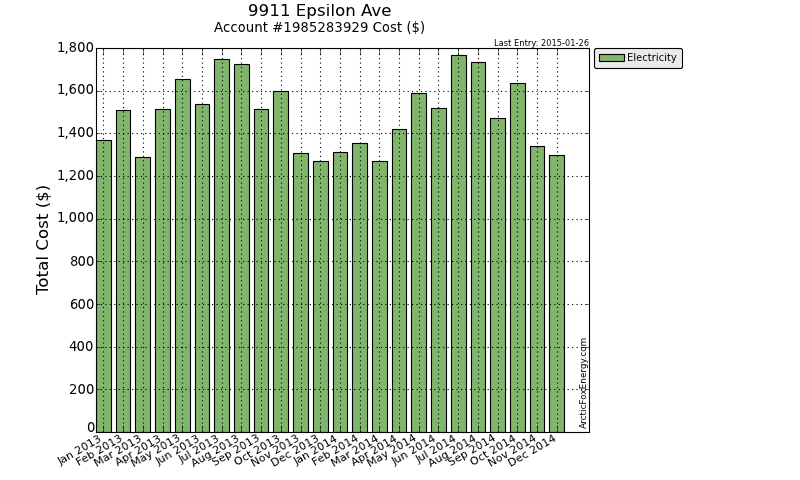
| Date | Adj Elec Usage (kWh) | Read Usage (kWh) | Demand (kW) | PF (%) | Elec Cost ($) | Demand Cost ($) | PF Cost ($) | Total Elec Cost ($) | GHG (tCO2e) |
|---|---|---|---|---|---|---|---|---|---|
| Jan 2013 | 20,842.56 | 21,976.92 | 43.34 | 110.28 | 1,165.61 | 33.97 | 0.00 | 1,370.75 | 0.29 |
| Feb 2013 | 18,973.83 | 20,131.56 | 53.99 | 87.00 | 1,292.71 | 54.02 | 0.00 | 1,509.11 | 0.27 |
| Mar 2013 | 19,395.97 | 17,891.13 | 59.22 | 110.29 | 1,069.90 | 64.44 | 0.00 | 1,288.12 | 0.27 |
| Apr 2013 | 19,392.56 | 21,476.62 | 53.55 | 109.58 | 1,252.32 | 84.53 | 0.00 | 1,516.05 | 0.27 |
| May 2013 | 19,748.84 | 20,607.80 | 62.46 | 103.63 | 1,386.94 | 96.18 | 0.00 | 1,655.75 | 0.28 |
| Jun 2013 | 22,902.20 | 21,125.45 | 68.91 | 89.69 | 1,250.99 | 104.83 | 0.00 | 1,535.33 | 0.32 |
| Jul 2013 | 24,841.10 | 25,049.19 | 70.75 | 90.47 | 1,433.33 | 124.67 | 0.00 | 1,746.12 | 0.35 |
| Aug 2013 | 23,804.28 | 22,226.21 | 66.13 | 104.84 | 1,438.82 | 111.17 | 0.00 | 1,723.17 | 0.33 |
| Sep 2013 | 22,760.41 | 24,732.22 | 67.05 | 102.97 | 1,236.76 | 91.86 | 0.00 | 1,513.67 | 0.32 |
| Oct 2013 | 20,949.38 | 21,317.83 | 54.56 | 94.95 | 1,349.42 | 81.09 | 0.00 | 1,599.11 | 0.29 |
| Nov 2013 | 18,272.01 | 19,647.43 | 52.16 | 106.30 | 1,104.89 | 49.09 | 0.00 | 1,305.88 | 0.26 |
| Dec 2013 | 17,866.28 | 16,944.89 | 53.01 | 98.96 | 1,054.10 | 49.45 | 0.00 | 1,270.37 | 0.25 |
| Jan 2014 | 20,635.50 | 18,965.14 | 41.66 | 105.28 | 1,147.02 | 38.40 | 0.00 | 1,311.87 | 0.21 |
| Feb 2014 | 19,607.42 | 20,002.43 | 42.16 | 92.70 | 1,175.11 | 36.25 | 0.00 | 1,352.66 | 0.20 |
| Mar 2014 | 17,970.75 | 18,344.35 | 59.45 | 108.49 | 1,067.11 | 56.89 | 0.00 | 1,272.36 | 0.18 |
| Apr 2014 | 20,523.25 | 21,105.74 | 59.27 | 102.28 | 1,167.49 | 87.81 | 0.00 | 1,420.08 | 0.21 |
| May 2014 | 18,676.32 | 18,197.87 | 64.56 | 94.94 | 1,290.27 | 127.73 | 0.00 | 1,591.38 | 0.19 |
| Jun 2014 | 20,435.33 | 20,481.53 | 61.68 | 108.60 | 1,257.60 | 106.40 | 0.00 | 1,520.60 | 0.20 |
| Jul 2014 | 21,842.93 | 19,530.88 | 74.71 | 104.84 | 1,467.98 | 117.16 | 0.00 | 1,767.37 | 0.22 |
| Aug 2014 | 23,887.80 | 25,963.15 | 63.33 | 96.19 | 1,422.73 | 126.17 | 0.00 | 1,732.85 | 0.24 |
| Sep 2014 | 18,570.35 | 18,020.42 | 57.60 | 109.57 | 1,204.99 | 94.33 | 0.00 | 1,471.24 | 0.19 |
| Oct 2014 | 21,458.03 | 22,847.07 | 60.96 | 91.59 | 1,366.22 | 100.03 | 0.00 | 1,636.40 | 0.21 |
| Nov 2014 | 20,703.74 | 20,737.33 | 52.53 | 94.93 | 1,184.68 | 0.00 | 0.00 | 1,342.83 | 0.21 |
| Dec 2014 | 21,565.92 | 18,436.87 | 53.60 | 94.80 | 1,156.93 | 0.00 | 0.00 | 1,299.69 | 0.22 |
Download Monthly Data as a CSV file for import into Excel.
Yearly Data
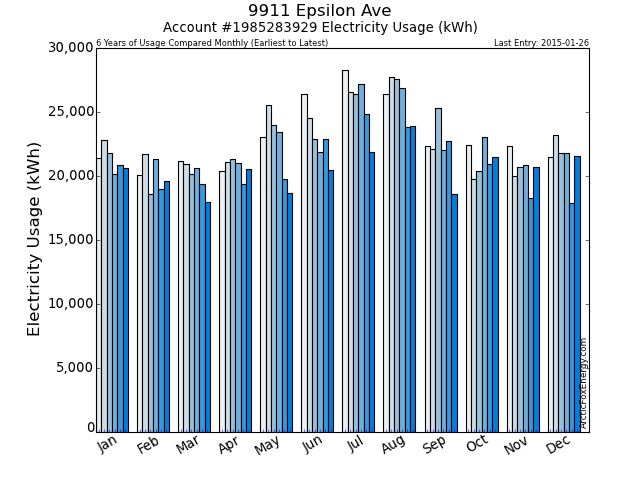
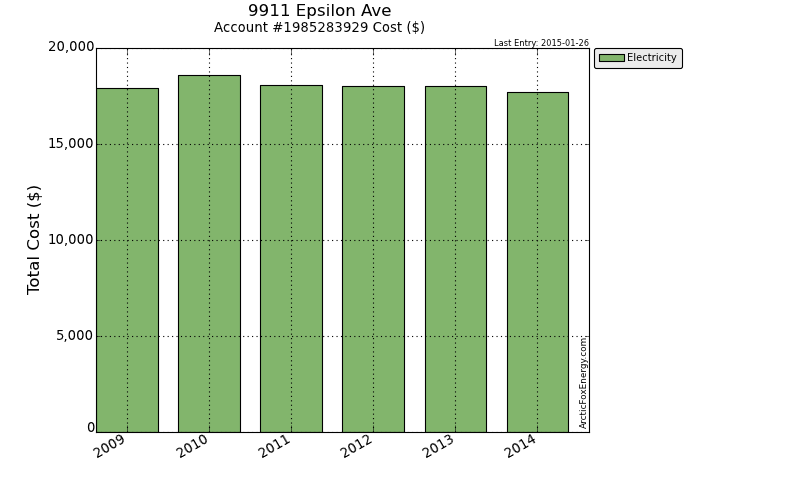
| Date | Elec Usage (kWh) | Total Elec Cost ($) | GHG (tCO2e) |
|---|---|---|---|
| 2009 | 275,682.25 | 17,893.06 | 7.17 |
| 2010 | 275,927.61 | 18,580.43 | 7.17 |
| 2011 | 270,993.64 | 18,068.97 | 6.77 |
| 2012 | 270,234.36 | 18,024.54 | 6.76 |
| 2013 | 249,749.41 | 18,033.43 | 3.50 |
| 2014 | 245,877.34 | 17,719.33 | 2.46 |
Download Yearly Data as a CSV file for import into Excel.
Notes
Please view the Report Notes page for important details about this report.
If any data appears unusual, please contact info@ArcticFoxEnergy.com for a manual verification. If any anomalies are detected, they will be immediately corrected.
