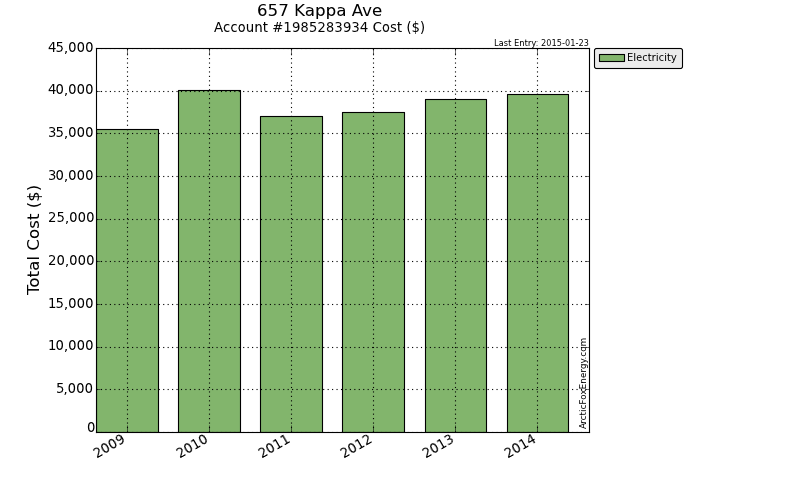
657 Kappa Ave
Details
Address: 657 Kappa Ave
Account #: 1985283934
Account Type: BC Hydro
Last Entry: 2015-01-23
Monthly Data
| Date | Adj Elec Usage (kWh) | Read Usage (kWh) | Demand (kW) | PF (%) | Elec Cost ($) | Demand Cost ($) | PF Cost ($) | Total Elec Cost ($) | GHG (tCO2e) |
|---|---|---|---|---|---|---|---|---|---|
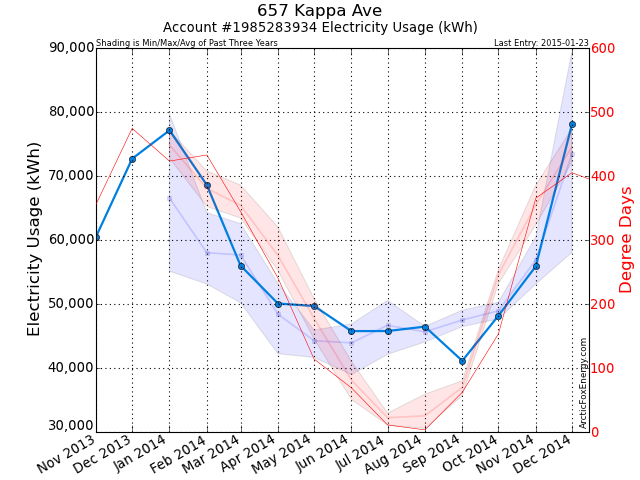
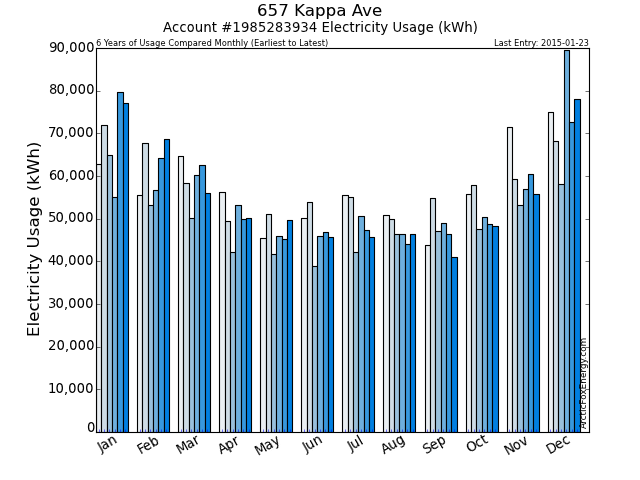
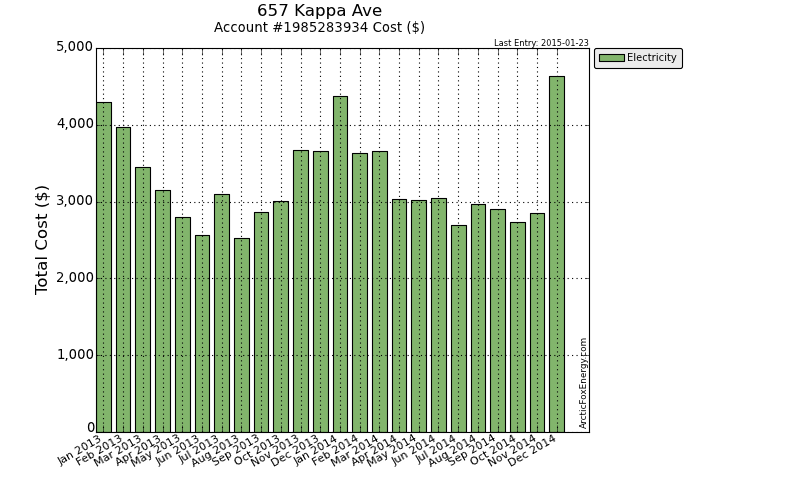
| Jan 2013 | 79,671.13 | 87,738.27 | 208.98 | 88.56 | 3,137.09 | 668.03 | 0.00 | 4,293.94 | 1.12 |
| Feb 2013 | 64,291.20 | 68,243.28 | 200.71 | 99.12 | 2,896.60 | 616.06 | 0.00 | 3,969.01 | 0.90 |
| Mar 2013 | 62,541.44 | 62,447.40 | 169.34 | 91.12 | 2,500.33 | 537.76 | 0.00 | 3,452.99 | 0.88 |
| Apr 2013 | 49,804.78 | 57,159.03 | 168.70 | 104.03 | 2,324.31 | 443.14 | 0.00 | 3,152.65 | 0.70 |
| May 2013 | 45,208.50 | 42,714.30 | 111.02 | 101.84 | 2,188.71 | 310.11 | 0.00 | 2,801.87 | 0.63 |
| Jun 2013 | 46,869.39 | 45,170.64 | 137.44 | 91.26 | 1,860.53 | 383.29 | 0.00 | 2,560.38 | 0.66 |
| Jul 2013 | 47,289.73 | 51,918.59 | 136.78 | 106.95 | 2,343.57 | 401.74 | 0.00 | 3,105.07 | 0.66 |
| Aug 2013 | 44,066.01 | 39,484.57 | 147.54 | 95.55 | 1,908.66 | 321.39 | 0.00 | 2,526.75 | 0.62 |
| Sep 2013 | 46,465.67 | 51,744.73 | 118.13 | 95.41 | 2,294.74 | 265.16 | 0.00 | 2,861.44 | 0.65 |
| Oct 2013 | 48,855.50 | 44,165.69 | 117.75 | 106.69 | 2,318.56 | 361.81 | 0.00 | 3,002.21 | 0.68 |
| Nov 2013 | 60,505.82 | 57,955.49 | 159.70 | 98.41 | 2,708.93 | 583.35 | 0.00 | 3,677.21 | 0.85 |
| Dec 2013 | 72,700.92 | 64,293.14 | 164.90 | 85.28 | 2,545.05 | 682.03 | 0.00 | 3,661.69 | 1.02 |
| Jan 2014 | 77,134.88 | 80,787.50 | 208.68 | 94.52 | 3,028.59 | 910.44 | 0.00 | 4,379.31 | 0.77 |
| Feb 2014 | 68,593.76 | 72,899.53 | 187.65 | 95.15 | 2,519.78 | 667.03 | 0.00 | 3,626.41 | 0.69 |
| Mar 2014 | 55,999.51 | 62,418.96 | 161.03 | 86.74 | 2,838.22 | 457.44 | 0.00 | 3,659.57 | 0.56 |
| Apr 2014 | 50,071.56 | 48,832.17 | 167.78 | 100.70 | 2,200.70 | 452.93 | 0.00 | 3,037.84 | 0.50 |
| May 2014 | 49,685.83 | 48,611.13 | 135.30 | 98.49 | 2,294.30 | 393.27 | 0.00 | 3,026.43 | 0.50 |
| Jun 2014 | 45,763.63 | 48,117.04 | 127.64 | 88.53 | 2,421.99 | 357.12 | 0.00 | 3,052.34 | 0.46 |
| Jul 2014 | 45,775.68 | 43,130.94 | 105.85 | 102.45 | 2,091.52 | 297.52 | 0.00 | 2,696.35 | 0.46 |
| Aug 2014 | 46,463.88 | 46,068.76 | 118.92 | 104.30 | 2,322.27 | 350.75 | 0.00 | 2,963.61 | 0.46 |
| Sep 2014 | 41,125.92 | 43,242.36 | 113.17 | 106.18 | 2,305.92 | 289.47 | 0.00 | 2,905.28 | 0.41 |
| Oct 2014 | 48,178.67 | 45,518.82 | 112.25 | 88.96 | 2,082.27 | 356.68 | 0.00 | 2,734.81 | 0.48 |
| Nov 2014 | 55,897.15 | 45,490.48 | 126.80 | 101.59 | 2,511.17 | 0.00 | 0.00 | 2,845.69 | 0.56 |
| Dec 2014 | 78,063.26 | 82,852.03 | 173.56 | 91.77 | 4,174.04 | 0.00 | 0.00 | 4,632.82 | 0.78 |
Download Monthly Data as a CSV file for import into Excel.
Yearly Data
| Date | Elec Usage (kWh) | Total Elec Cost ($) | GHG (tCO2e) |
|---|---|---|---|
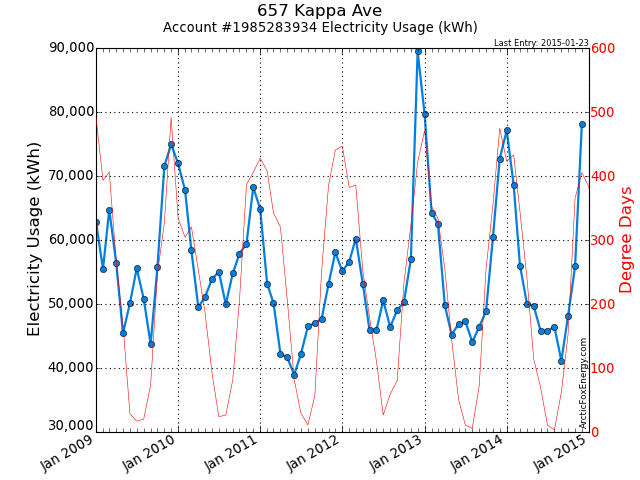
| 2009 | 687,376.30 | 35,539.18 | 17.87 |
| 2010 | 697,935.15 | 40,058.07 | 18.15 |
| 2011 | 585,510.34 | 37,056.83 | 14.64 |
| 2012 | 659,832.02 | 37,477.47 | 16.50 |
| 2013 | 668,270.10 | 39,065.20 | 9.36 |
| 2014 | 662,753.72 | 39,560.45 | 6.63 |
Download Yearly Data as a CSV file for import into Excel.
Notes
Please view the Report Notes page for important details about this report.
If any data appears unusual, please contact info@ArcticFoxEnergy.com for a manual verification. If any anomalies are detected, they will be immediately corrected.
