9999 Works Way
Details
Address: 9999 Works Way
Account #: 1985283937
Account Type: BC Hydro
Last Entry: 2015-01-21
Monthly Data
| Date | Adj Elec Usage (kWh) | Read Usage (kWh) | Demand (kW) | PF (%) | Elec Cost ($) | Demand Cost ($) | PF Cost ($) | Total Elec Cost ($) | GHG (tCO2e) |
|---|---|---|---|---|---|---|---|---|---|
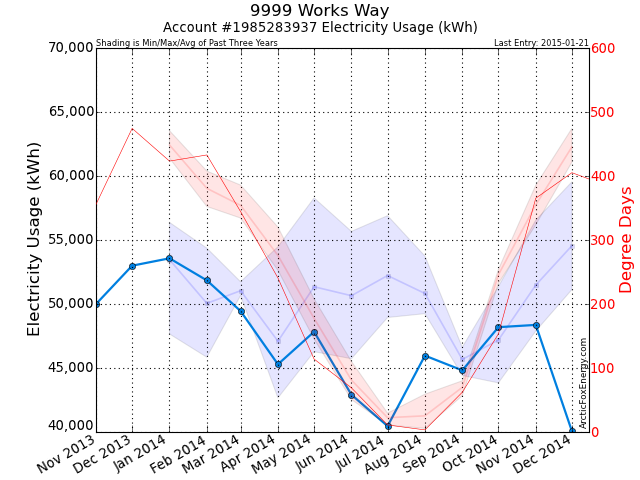
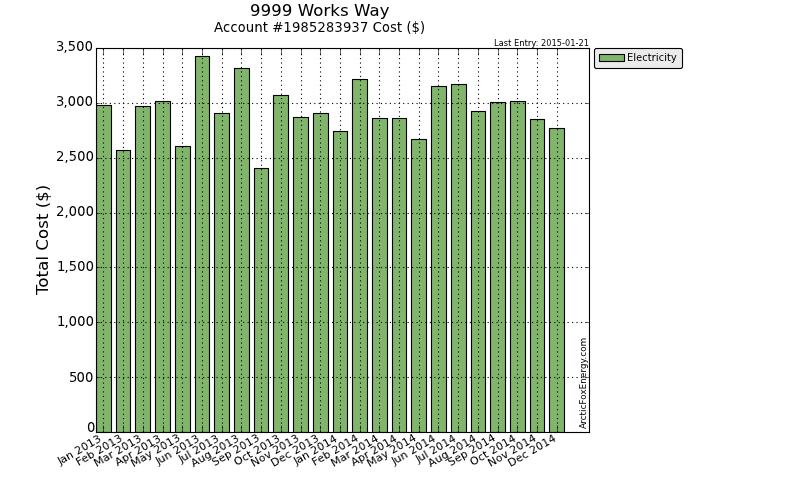
| Jan 2013 | 47,660.39 | 51,120.51 | 135.31 | 89.24 | 2,312.23 | 320.18 | 0.00 | 2,985.00 | 0.67 |
| Feb 2013 | 45,841.94 | 42,805.23 | 111.53 | 104.36 | 1,922.97 | 314.65 | 0.00 | 2,568.65 | 0.64 |
| Mar 2013 | 51,737.85 | 53,120.22 | 167.74 | 96.33 | 2,181.72 | 441.73 | 0.00 | 2,969.80 | 0.72 |
| Apr 2013 | 42,662.00 | 50,864.78 | 101.94 | 94.45 | 2,450.67 | 273.62 | 0.00 | 3,018.17 | 0.60 |
| May 2013 | 49,481.22 | 37,011.11 | 149.36 | 88.20 | 1,890.43 | 408.72 | 0.00 | 2,603.70 | 0.69 |
| Jun 2013 | 50,548.06 | 58,480.16 | 193.10 | 105.31 | 2,354.83 | 692.84 | 0.00 | 3,427.16 | 0.71 |
| Jul 2013 | 50,828.84 | 46,929.55 | 143.60 | 86.86 | 2,092.46 | 470.94 | 0.00 | 2,907.16 | 0.71 |
| Aug 2013 | 49,476.97 | 54,553.71 | 197.63 | 102.06 | 2,163.49 | 778.56 | 0.00 | 3,317.37 | 0.69 |
| Sep 2013 | 44,417.11 | 46,469.95 | 139.23 | 98.31 | 1,725.39 | 388.34 | 0.00 | 2,406.10 | 0.62 |
| Oct 2013 | 43,838.34 | 45,703.78 | 204.13 | 99.19 | 2,016.40 | 679.28 | 0.00 | 3,073.61 | 0.61 |
| Nov 2013 | 49,995.16 | 42,027.54 | 186.82 | 104.73 | 1,811.45 | 686.84 | 0.00 | 2,869.47 | 0.70 |
| Dec 2013 | 52,993.34 | 51,270.14 | 141.10 | 101.63 | 2,194.48 | 391.62 | 0.00 | 2,906.47 | 0.74 |
| Jan 2014 | 53,569.30 | 49,763.54 | 134.73 | 105.70 | 2,090.33 | 351.77 | 0.00 | 2,743.40 | 0.54 |
| Feb 2014 | 51,844.18 | 57,458.03 | 140.86 | 91.32 | 2,524.90 | 352.91 | 0.00 | 3,214.47 | 0.52 |
| Mar 2014 | 49,447.98 | 51,683.84 | 173.94 | 103.86 | 2,119.95 | 446.21 | 0.00 | 2,858.93 | 0.49 |
| Apr 2014 | 45,288.83 | 48,738.51 | 137.85 | 102.62 | 2,195.10 | 353.31 | 0.00 | 2,857.52 | 0.45 |
| May 2014 | 47,830.56 | 43,070.80 | 111.08 | 106.08 | 2,149.73 | 243.44 | 0.00 | 2,672.22 | 0.48 |
| Jun 2014 | 42,913.42 | 47,922.16 | 165.96 | 106.82 | 2,177.24 | 636.44 | 0.00 | 3,154.04 | 0.43 |
| Jul 2014 | 40,459.05 | 39,251.35 | 152.83 | 87.20 | 2,364.22 | 474.44 | 0.00 | 3,170.13 | 0.40 |
| Aug 2014 | 45,966.61 | 42,191.50 | 129.39 | 95.57 | 2,305.77 | 311.29 | 0.00 | 2,922.92 | 0.46 |
| Sep 2014 | 44,816.07 | 47,279.21 | 166.94 | 86.58 | 2,156.68 | 527.44 | 0.00 | 3,011.31 | 0.45 |
| Oct 2014 | 48,190.08 | 46,690.78 | 179.17 | 85.13 | 2,138.12 | 557.79 | 0.00 | 3,018.39 | 0.48 |
| Nov 2014 | 48,366.64 | 50,085.65 | 203.34 | 98.44 | 2,514.46 | 0.00 | 0.00 | 2,852.47 | 0.48 |
| Dec 2014 | 40,060.24 | 43,915.29 | 133.26 | 104.00 | 2,494.15 | 0.00 | 0.00 | 2,772.79 | 0.40 |
Download Monthly Data as a CSV file for import into Excel.
Yearly Data
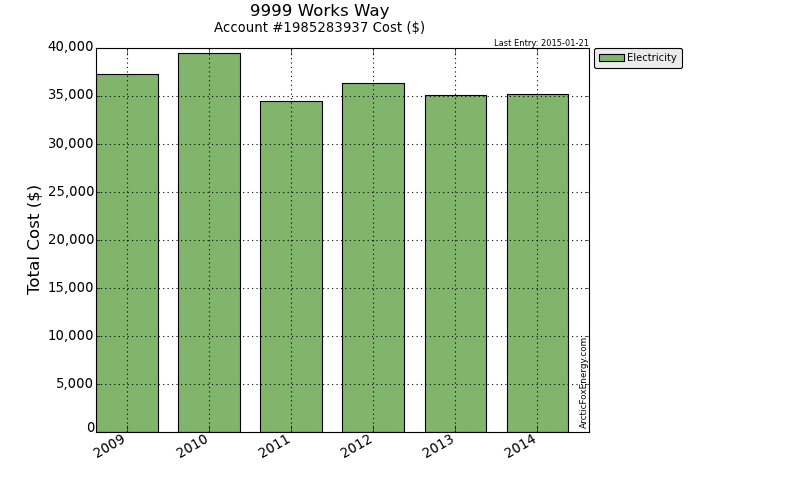
| Date | Elec Usage (kWh) | Total Elec Cost ($) | GHG (tCO2e) |
|---|---|---|---|
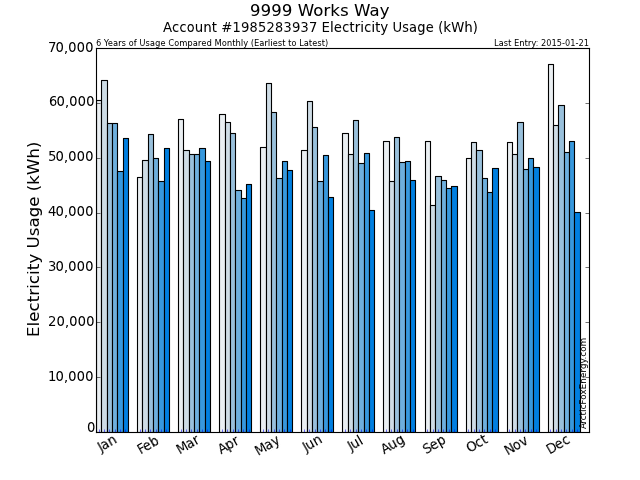
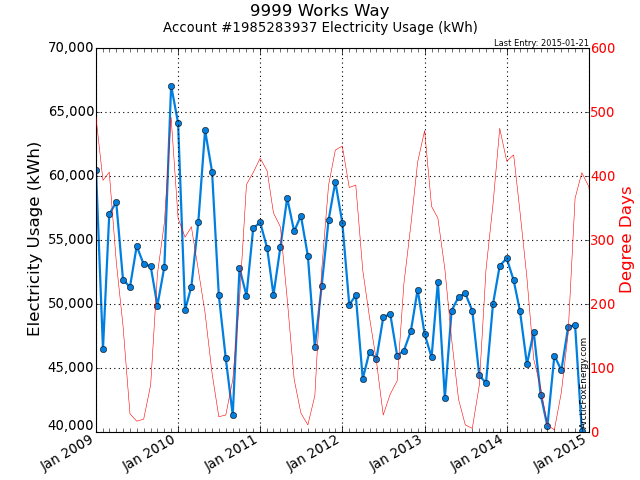
| 2009 | 655,609.81 | 37,306.79 | 17.05 |
| 2010 | 642,475.43 | 39,509.57 | 16.70 |
| 2011 | 654,609.64 | 34,474.46 | 16.37 |
| 2012 | 582,669.78 | 36,368.13 | 14.57 |
| 2013 | 579,481.22 | 35,052.64 | 8.11 |
| 2014 | 558,752.95 | 35,248.61 | 5.59 |
Download Yearly Data as a CSV file for import into Excel.
Notes
Please view the Report Notes page for important details about this report.
If any data appears unusual, please contact info@ArcticFoxEnergy.com for a manual verification. If any anomalies are detected, they will be immediately corrected.
