Gamma Community Hall
Details
Name: Gamma Community Hall
Address: 853 Social Rd
Size: 8475 sqft
Year Built: 1991
Floors: 1
Legal Description:
PID:
Monthly Electricity Data
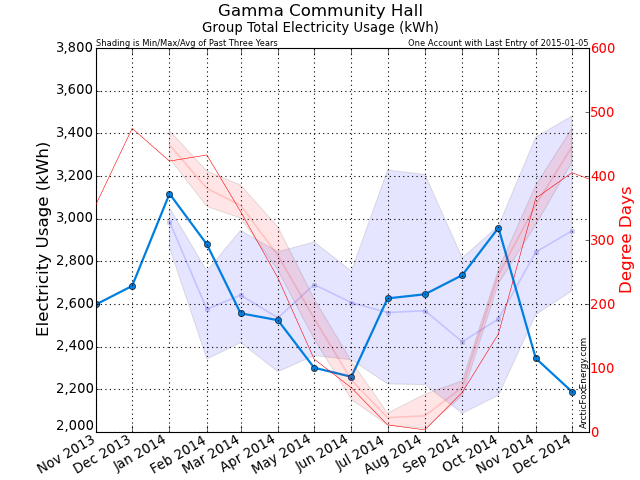
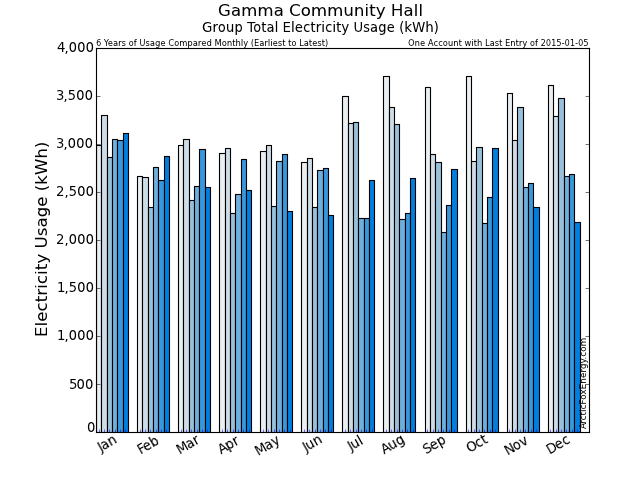
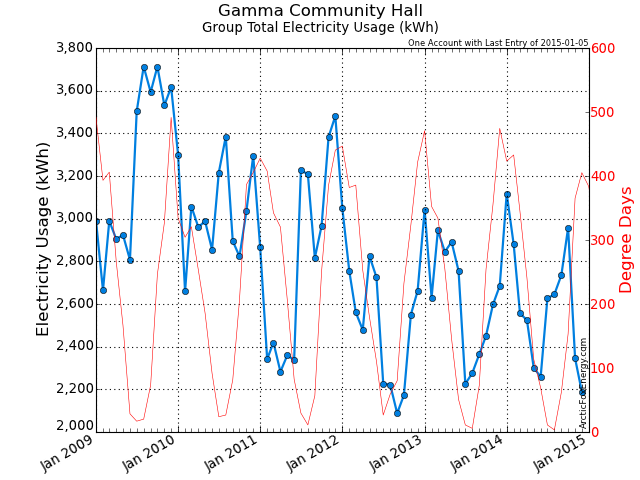
| Date | Adj Elec Usage (kWh) | Read Usage (kWh) | Elec Cost ($) | Demand Cost ($) | PF Cost ($) | Total Elec Cost ($) | GHG (tCO2e) |
|---|---|---|---|---|---|---|---|
| Jan 2013 | 3,041.84 | 3,238.09 | 244.86 | 0.00 | 0.00 | 271.97 | 0.04 |
| Feb 2013 | 2,629.76 | 2,439.76 | 180.23 | 0.00 | 0.00 | 204.43 | 0.04 |
| Mar 2013 | 2,945.03 | 0.00 | 0.00 | 0.00 | 0.00 | 0.00 | 0.04 |
| Apr 2013 | 2,844.79 | 5,700.05 | 341.21 | 0.00 | 0.00 | 388.32 | 0.04 |
| May 2013 | 2,890.94 | 0.00 | 0.00 | 0.00 | 0.00 | 0.00 | 0.04 |
| Jun 2013 | 2,754.75 | 5,781.88 | 384.66 | 0.00 | 0.00 | 434.35 | 0.04 |
| Jul 2013 | 2,225.49 | 0.00 | 0.00 | 0.00 | 0.00 | 0.00 | 0.03 |
| Aug 2013 | 2,276.35 | 4,645.42 | 345.02 | 0.00 | 0.00 | 382.39 | 0.03 |
| Sep 2013 | 2,364.23 | 0.00 | 0.00 | 0.00 | 0.00 | 0.00 | 0.03 |
| Oct 2013 | 2,450.83 | 4,728.45 | 340.54 | 0.00 | 0.00 | 391.54 | 0.03 |
| Nov 2013 | 2,598.02 | 0.00 | 0.00 | 0.00 | 0.00 | 0.00 | 0.04 |
| Dec 2013 | 2,684.62 | 5,369.24 | 350.81 | 0.00 | 0.00 | 401.37 | 0.04 |
| Jan 2014 | 3,116.98 | 0.00 | 0.00 | 0.00 | 0.00 | 0.00 | 0.03 |
| Feb 2014 | 2,879.72 | 5,831.76 | 382.31 | 0.00 | 0.00 | 430.28 | 0.03 |
| Mar 2014 | 2,556.43 | 2,721.36 | 192.49 | 0.00 | 0.00 | 216.28 | 0.03 |
| Apr 2014 | 2,524.16 | 2,449.92 | 163.04 | 0.00 | 0.00 | 184.14 | 0.03 |
| May 2014 | 2,301.52 | 0.00 | 0.00 | 0.00 | 0.00 | 0.00 | 0.02 |
| Jun 2014 | 2,258.70 | 4,380.31 | 370.20 | 0.00 | 0.00 | 413.97 | 0.02 |
| Jul 2014 | 2,626.23 | 0.00 | 0.00 | 0.00 | 0.00 | 0.00 | 0.03 |
| Aug 2014 | 2,645.61 | 5,252.45 | 374.97 | 0.00 | 0.00 | 424.18 | 0.03 |
| Sep 2014 | 2,735.33 | 0.00 | 0.00 | 0.00 | 0.00 | 0.00 | 0.03 |
| Oct 2014 | 2,956.88 | 5,653.03 | 401.46 | 0.00 | 0.00 | 454.77 | 0.03 |
| Nov 2014 | 2,345.40 | 0.00 | 0.00 | 0.00 | 0.00 | 0.00 | 0.02 |
| Dec 2014 | 2,189.04 | 4,847.16 | 422.64 | 0.00 | 0.00 | 424.10 | 0.02 |
Download Monthly Electricity Data as a CSV file for import into Excel.
Monthly Gas Data
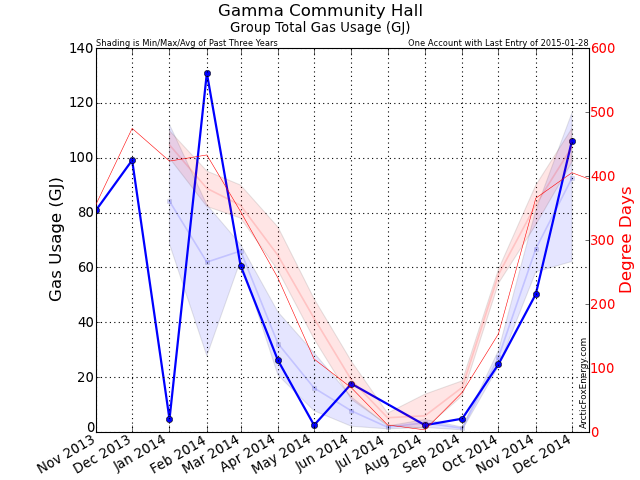
| Date | Adj Gas Usage (GJ) | Read Usage (GJ) | Gas Cost ($) | Basic / Mgmt Cost ($) | Delivery Cost ($) | Midstream Cost ($) | Total Gas Cost ($) | GHG (tCO2e) |
|---|---|---|---|---|---|---|---|---|
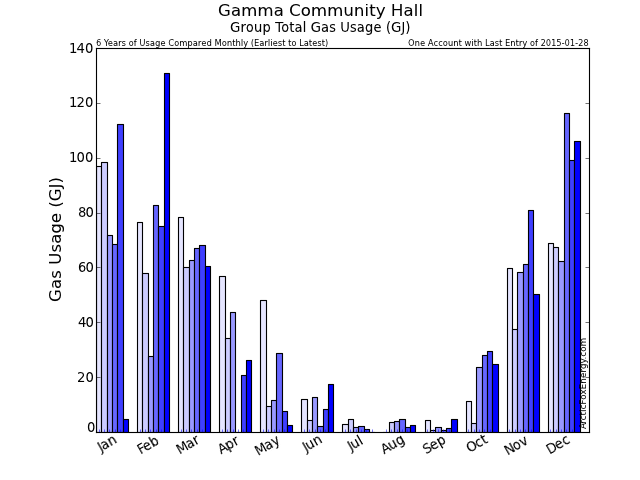
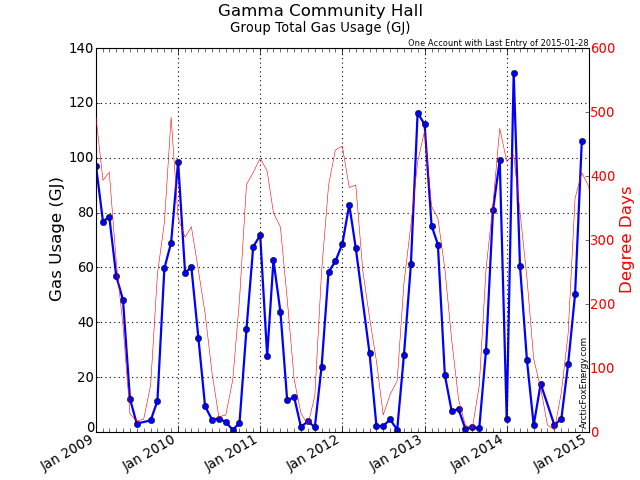
| Jan 2013 | 112.12 | 112.12 | 1,370.27 | 26.52 | 0.00 | 0.00 | 1,396.79 | 5.58 |
| Feb 2013 | 75.22 | 75.22 | 1,078.39 | 25.63 | 0.00 | 0.00 | 1,104.02 | 3.74 |
| Mar 2013 | 68.36 | 68.36 | 788.78 | 28.70 | 0.00 | 0.00 | 817.49 | 3.40 |
| Apr 2013 | 20.75 | 20.75 | 254.16 | 26.08 | 0.00 | 0.00 | 280.24 | 1.03 |
| May 2013 | 7.74 | 7.74 | 90.44 | 27.83 | 0.00 | 0.00 | 118.27 | 0.39 |
| Jun 2013 | 8.26 | 8.26 | 92.27 | 24.01 | 0.00 | 0.00 | 116.28 | 0.41 |
| Jul 2013 | 1.16 | 1.16 | 14.38 | 26.91 | 0.00 | 0.00 | 41.29 | 0.06 |
| Aug 2013 | 1.66 | 1.66 | 20.70 | 25.90 | 0.00 | 0.00 | 46.59 | 0.08 |
| Sep 2013 | 1.43 | 1.43 | 15.13 | 23.16 | 0.00 | 0.00 | 38.29 | 0.07 |
| Oct 2013 | 29.70 | 29.70 | 426.04 | 28.60 | 0.00 | 0.00 | 454.64 | 1.48 |
| Nov 2013 | 80.85 | 80.85 | 1,070.04 | 27.68 | 0.00 | 0.00 | 1,097.72 | 4.02 |
| Dec 2013 | 99.09 | 99.09 | 1,211.04 | 25.79 | 0.00 | 0.00 | 1,236.84 | 4.93 |
| Jan 2014 | 4.67 | 0.00 | 0.00 | 0.00 | 0.00 | 0.00 | 0.00 | 0.23 |
| Feb 2014 | 130.86 | 135.53 | 1,889.98 | 55.59 | 0.00 | 0.00 | 1,945.57 | 6.51 |
| Mar 2014 | 60.66 | 60.66 | 737.87 | 25.27 | 0.00 | 0.00 | 763.14 | 3.02 |
| Apr 2014 | 26.14 | 26.14 | 347.03 | 26.92 | 0.00 | 0.00 | 373.95 | 1.30 |
| May 2014 | 2.49 | 2.49 | 33.90 | 29.12 | 0.00 | 0.00 | 63.01 | 0.12 |
| Jun 2014 | 17.59 | 17.59 | 204.20 | 24.73 | 0.00 | 0.00 | 228.94 | 0.88 |
| Jul 2014 | 0.00 | 0.00 | 0.00 | 0.00 | 0.00 | 0.00 | 0.00 | 0.00 |
| Aug 2014 | 2.49 | 2.49 | 39.29 | 23.66 | 0.00 | 0.00 | 62.95 | 0.12 |
| Sep 2014 | 4.87 | 4.87 | 60.87 | 27.91 | 0.00 | 0.00 | 88.78 | 0.24 |
| Oct 2014 | 24.68 | 21.56 | 333.06 | 25.98 | 0.00 | 0.00 | 359.04 | 1.23 |
| Nov 2014 | 50.24 | 46.91 | 352.95 | 21.96 | 120.03 | 68.31 | 663.49 | 2.50 |
| Dec 2014 | 106.20 | 103.36 | 764.14 | 24.52 | 240.16 | 145.55 | 1,361.39 | 5.28 |
Download Monthly Gas Data as a CSV file for import into Excel.
Monthly Total Data
| Date | Adj Gas Usage (GJ) | Total Gas Cost ($) | Adj Elec Usage (kWh) | Total Elec Cost ($) | Total Usage (ekWh) | Total Cost ($) | GHG (tCO2e) |
|---|---|---|---|---|---|---|---|
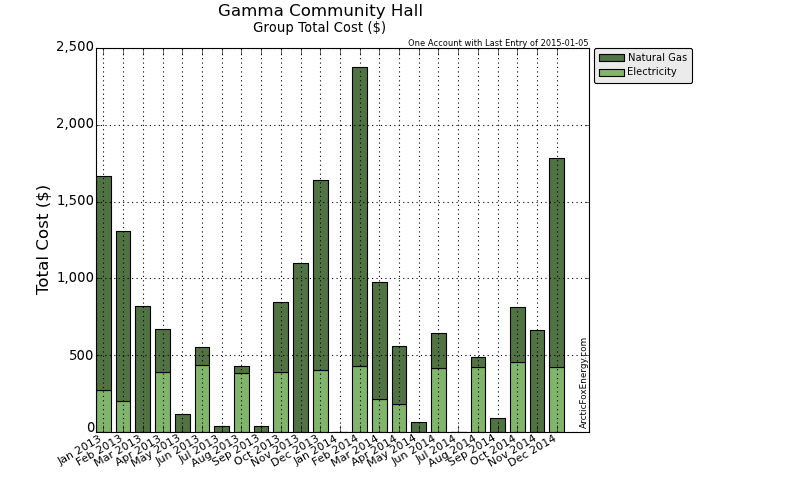
| Jan 2013 | 112.12 | 1,396.79 | 3,041.84 | 271.97 | 34,185.53 | 1,668.76 | 5.62 |
| Feb 2013 | 75.22 | 1,104.02 | 2,629.76 | 204.43 | 23,524.56 | 1,308.45 | 3.78 |
| Mar 2013 | 68.36 | 817.49 | 2,945.03 | 0.00 | 21,933.46 | 817.49 | 3.44 |
| Apr 2013 | 20.75 | 280.24 | 2,844.79 | 388.32 | 8,609.38 | 668.56 | 1.07 |
| May 2013 | 7.74 | 118.27 | 2,890.94 | 0.00 | 5,041.15 | 118.27 | 0.43 |
| Jun 2013 | 8.26 | 116.28 | 2,754.75 | 434.35 | 5,049.67 | 550.63 | 0.45 |
| Jul 2013 | 1.16 | 41.29 | 2,225.49 | 0.00 | 2,547.98 | 41.29 | 0.09 |
| Aug 2013 | 1.66 | 46.59 | 2,276.35 | 382.39 | 2,737.99 | 428.98 | 0.11 |
| Sep 2013 | 1.43 | 38.29 | 2,364.23 | 0.00 | 2,762.19 | 38.29 | 0.10 |
| Oct 2013 | 29.70 | 454.64 | 2,450.83 | 391.54 | 10,699.66 | 846.18 | 1.51 |
| Nov 2013 | 80.85 | 1,097.72 | 2,598.02 | 0.00 | 25,057.31 | 1,097.72 | 4.06 |
| Dec 2013 | 99.09 | 1,236.84 | 2,684.62 | 401.37 | 30,209.19 | 1,638.20 | 4.97 |
| Jan 2014 | 4.67 | 0.00 | 3,116.98 | 0.00 | 4,415.15 | 0.00 | 0.26 |
| Feb 2014 | 130.86 | 1,945.57 | 2,879.72 | 430.28 | 39,228.72 | 2,375.85 | 6.54 |
| Mar 2014 | 60.66 | 763.14 | 2,556.43 | 216.28 | 19,405.89 | 979.42 | 3.04 |
| Apr 2014 | 26.14 | 373.95 | 2,524.16 | 184.14 | 9,785.85 | 558.09 | 1.33 |
| May 2014 | 2.49 | 63.01 | 2,301.52 | 0.00 | 2,994.03 | 63.01 | 0.15 |
| Jun 2014 | 17.59 | 228.94 | 2,258.70 | 413.97 | 7,146.13 | 642.91 | 0.90 |
| Jul 2014 | 0.00 | 0.00 | 2,626.23 | 0.00 | 2,626.23 | 0.00 | 0.03 |
| Aug 2014 | 2.49 | 62.95 | 2,645.61 | 424.18 | 3,337.17 | 487.12 | 0.15 |
| Sep 2014 | 4.87 | 88.78 | 2,735.33 | 0.00 | 4,087.58 | 88.78 | 0.27 |
| Oct 2014 | 24.68 | 359.04 | 2,956.88 | 454.77 | 9,813.63 | 813.81 | 1.26 |
| Nov 2014 | 50.24 | 663.49 | 2,345.40 | 0.00 | 16,301.61 | 663.49 | 2.52 |
| Dec 2014 | 106.20 | 1,361.39 | 2,189.04 | 424.10 | 31,688.22 | 1,785.49 | 5.31 |
Download Monthly Total Data as a CSV file for import into Excel.
Yearly Data
| Date | Gas Usage (GJ) | Total Gas Cost ($) | Elec Usage (kWh) | Total Elec Cost ($) | Total Usage (ekWh) | Total Cost ($) | GHG (tCO2e) |
|---|---|---|---|---|---|---|---|
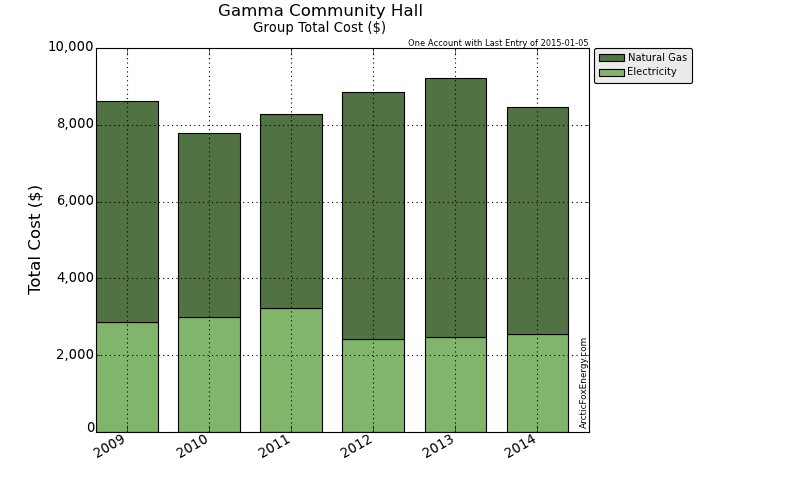
| 2009 | 516.76 | 5,739.44 | 38,948.70 | 2,873.18 | 182,494.17 | 8,612.63 | 26.72 |
| 2010 | 382.74 | 4,785.59 | 36,469.76 | 2,999.53 | 142,785.61 | 7,785.12 | 19.99 |
| 2011 | 382.12 | 5,062.36 | 33,687.80 | 3,223.53 | 139,832.84 | 8,285.89 | 19.85 |
| 2012 | 462.31 | 6,434.19 | 30,315.45 | 2,419.14 | 158,736.18 | 8,853.33 | 23.76 |
| 2013 | 506.35 | 6,748.45 | 31,706.64 | 2,474.38 | 172,358.08 | 9,222.83 | 25.63 |
| 2014 | 430.90 | 5,910.27 | 31,135.99 | 2,547.72 | 150,830.21 | 8,457.98 | 21.75 |
Download Yearly Data as a CSV file for import into Excel.
Metrics
Area Benchmark: - ekWh/sq.m
Hours of Usage per Year: 8760 hours
| Date | Gas Usage per Square Foot (GJ/sq.ft) | Gas Usage per Square Metre (GJ/sq.m) | Elec Usage per Square Foot (kWh/sq.ft) | Elec Usage per Square Metre (kWh/sq.m) |
|---|---|---|---|---|
| 2009 | 0.06 | 0.66 | 4.60 | 49.47 |
| 2010 | 0.05 | 0.49 | 4.30 | 46.32 |
| 2011 | 0.05 | 0.49 | 3.97 | 42.79 |
| 2012 | 0.05 | 0.59 | 3.58 | 38.50 |
| 2013 | 0.06 | 0.64 | 3.74 | 40.27 |
| 2014 | 0.05 | 0.55 | 3.67 | 39.55 |
| Date | Usage per Square Foot (ekWh/sq.ft) | Usage per Square Metre (ekWh/sq.m) | Percent of Benchmark | Usage per Hour (ekWh/h) |
|---|---|---|---|---|
| 2009 | 21.53 | 231.78 | n/a | 20.83 |
| 2010 | 16.85 | 181.35 | n/a | 16.30 |
| 2011 | 16.50 | 177.60 | n/a | 15.96 |
| 2012 | 18.73 | 201.61 | n/a | 18.12 |
| 2013 | 20.34 | 218.91 | n/a | 19.68 |
| 2014 | 17.80 | 191.57 | n/a | 17.22 |
Download Metric Data as a CSV file for import into Excel.
Notes
Please view the Report Notes page for important details about this report.
If any data appears unusual, please contact info@ArcticFoxEnergy.com for a manual verification. If any anomalies are detected, they will be immediately corrected.
