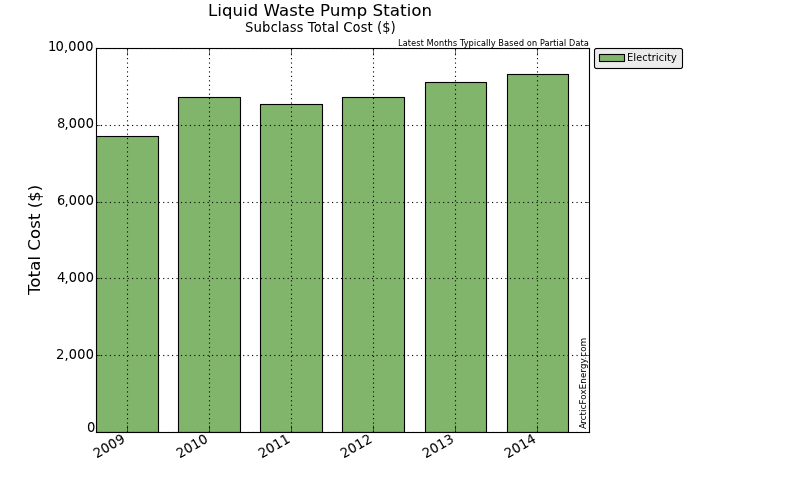
Liquid Waste Pump Station Subclass Total
Details
This page presents the totals for all accounts in the Liquid Waste Pump Station subclass.
Monthly Electricity Data
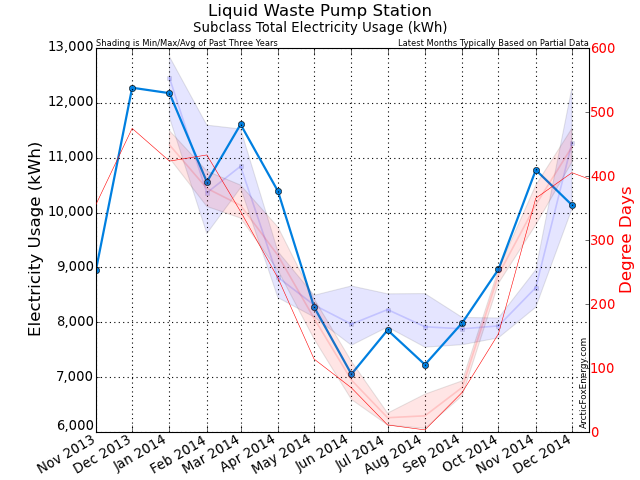
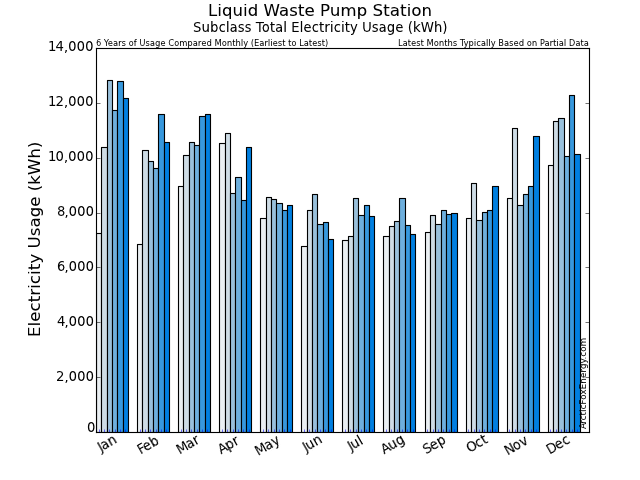
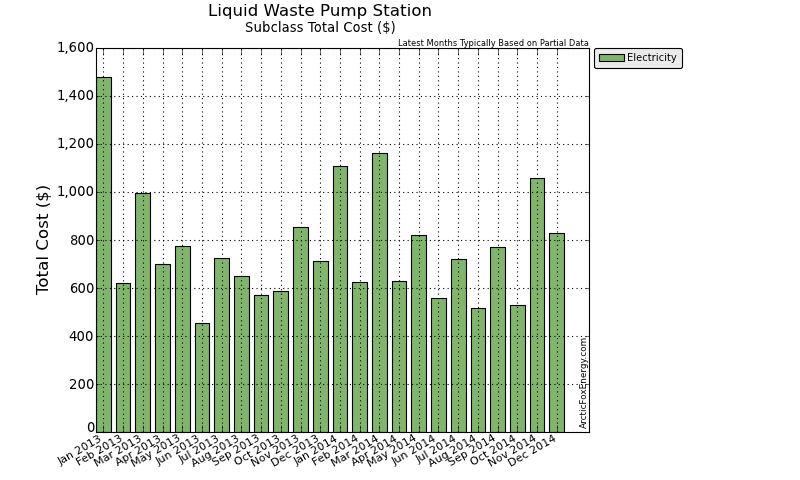
| Date | Adj Elec Usage (kWh) | Read Usage (kWh) | Elec Cost ($) | Demand Cost ($) | PF Cost ($) | Total Elec Cost ($) | GHG (tCO2e) |
|---|---|---|---|---|---|---|---|
| Jan 2013 | 12,791.33 | 18,195.87 | 1,291.60 | 13.32 | 0.00 | 1,480.27 | 0.18 |
| Feb 2013 | 11,593.77 | 7,842.68 | 552.93 | 0.72 | 0.00 | 620.89 | 0.16 |
| Mar 2013 | 11,522.71 | 12,730.19 | 878.59 | 0.00 | 0.00 | 995.41 | 0.16 |
| Apr 2013 | 8,449.08 | 7,888.74 | 624.91 | 0.00 | 0.00 | 700.78 | 0.12 |
| May 2013 | 8,096.27 | 9,497.34 | 687.59 | 0.00 | 0.00 | 776.22 | 0.11 |
| Jun 2013 | 7,654.52 | 6,055.02 | 395.94 | 0.00 | 0.00 | 452.92 | 0.11 |
| Jul 2013 | 8,262.52 | 10,112.00 | 632.81 | 0.00 | 0.00 | 724.43 | 0.12 |
| Aug 2013 | 7,546.94 | 8,096.11 | 570.48 | 0.00 | 0.00 | 650.32 | 0.11 |
| Sep 2013 | 7,962.90 | 7,392.17 | 506.84 | 0.00 | 0.00 | 571.26 | 0.11 |
| Oct 2013 | 8,079.13 | 6,396.47 | 525.17 | 0.00 | 0.00 | 586.34 | 0.11 |
| Nov 2013 | 8,957.15 | 10,515.89 | 751.07 | 0.00 | 0.00 | 853.98 | 0.13 |
| Dec 2013 | 12,275.93 | 8,714.71 | 641.14 | 0.00 | 0.00 | 712.82 | 0.17 |
| Jan 2014 | 12,176.35 | 14,793.29 | 933.06 | 49.91 | 0.00 | 1,106.26 | 0.12 |
| Feb 2014 | 10,558.23 | 8,685.92 | 556.25 | 0.00 | 0.00 | 625.86 | 0.11 |
| Mar 2014 | 11,607.73 | 15,730.00 | 1,037.69 | 0.00 | 0.00 | 1,160.60 | 0.12 |
| Apr 2014 | 10,389.83 | 7,612.96 | 563.59 | 0.00 | 0.00 | 629.30 | 0.10 |
| May 2014 | 8,278.19 | 10,189.07 | 728.19 | 0.00 | 0.00 | 819.57 | 0.08 |
| Jun 2014 | 7,054.47 | 5,368.43 | 500.56 | 0.00 | 0.00 | 557.62 | 0.07 |
| Jul 2014 | 7,858.12 | 8,942.01 | 644.44 | 0.00 | 0.00 | 719.61 | 0.08 |
| Aug 2014 | 7,227.79 | 5,490.71 | 457.77 | 0.00 | 0.00 | 515.11 | 0.07 |
| Sep 2014 | 7,991.44 | 9,839.36 | 684.59 | 0.00 | 0.00 | 772.30 | 0.08 |
| Oct 2014 | 8,964.06 | 6,571.82 | 473.30 | 0.00 | 0.00 | 527.71 | 0.09 |
| Nov 2014 | 10,776.47 | 12,829.86 | 938.68 | 0.00 | 0.00 | 1,056.38 | 0.11 |
| Dec 2014 | 10,137.83 | 9,805.61 | 739.63 | 0.00 | 0.00 | 828.73 | 0.10 |
Download Monthly Electricity Data as a CSV file for import into Excel.
Yearly Data
| Date | Gas Usage (GJ) | Total Gas Cost ($) | Elec Usage (kWh) | Total Elec Cost ($) | Total Usage (ekWh) | Total Cost ($) | GHG (tCO2e) |
|---|---|---|---|---|---|---|---|
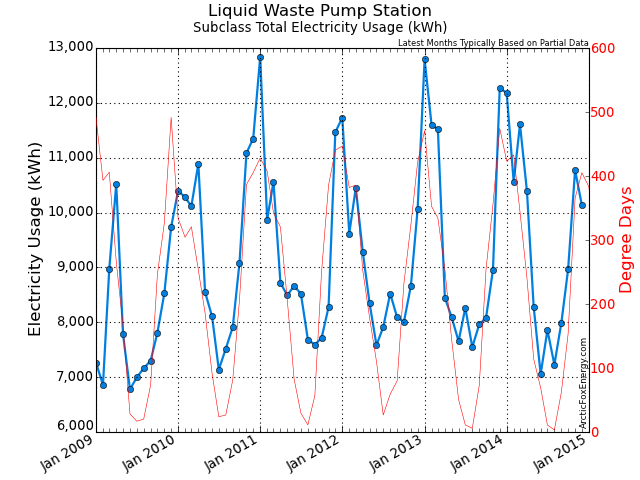
| 2009 | 0.00 | 0.00 | 95,706.48 | 7,696.77 | 95,706.48 | 7,696.77 | 2.49 |
| 2010 | 0.00 | 0.00 | 112,427.78 | 8,713.28 | 112,427.78 | 8,713.28 | 2.92 |
| 2011 | 0.00 | 0.00 | 110,394.77 | 8,542.88 | 110,394.77 | 8,542.88 | 2.76 |
| 2012 | 0.00 | 0.00 | 108,290.36 | 8,717.38 | 108,290.36 | 8,717.38 | 2.71 |
| 2013 | 0.00 | 0.00 | 113,192.26 | 9,125.64 | 113,192.26 | 9,125.64 | 1.58 |
| 2014 | 0.00 | 0.00 | 113,020.50 | 9,319.06 | 113,020.50 | 9,319.06 | 1.13 |
Download Yearly Data as a CSV file for import into Excel.
Notes
Please view the Report Notes page for important details about this report.
If any data appears unusual, please contact info@ArcticFoxEnergy.com for a manual verification. If any anomalies are detected, they will be immediately corrected.
