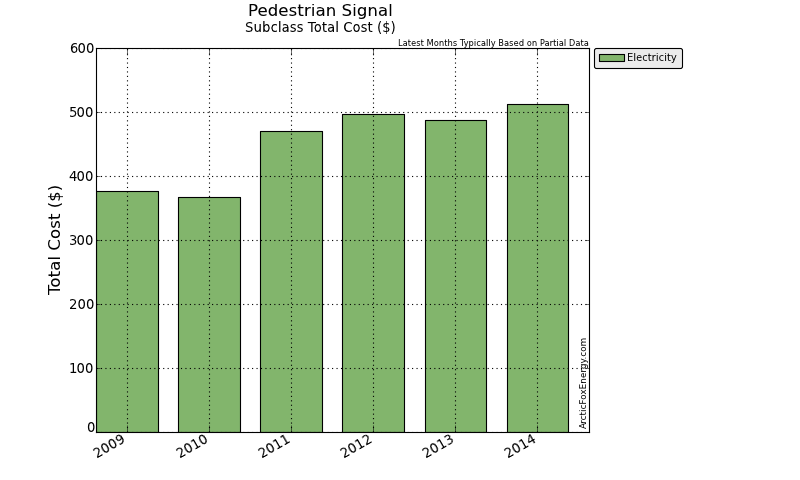
Pedestrian Signal Subclass Total
Details
This page presents the totals for all accounts in the Pedestrian Signal subclass.
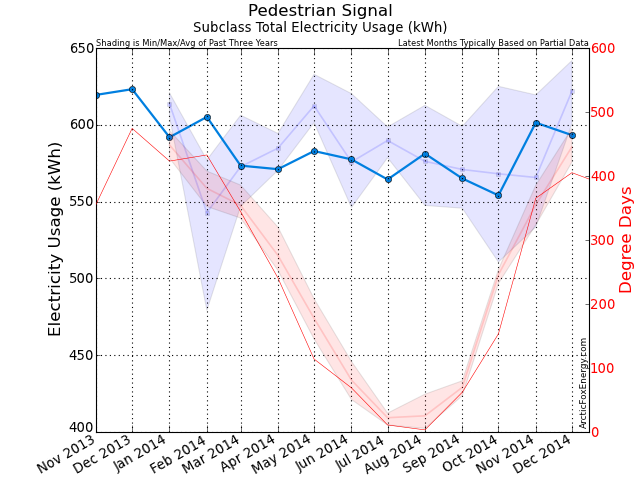
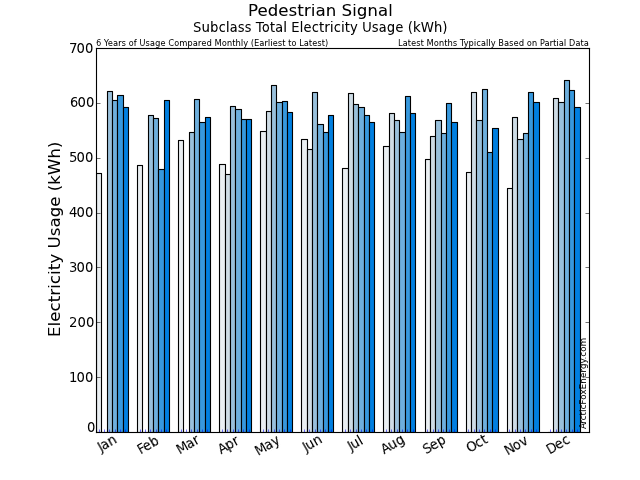
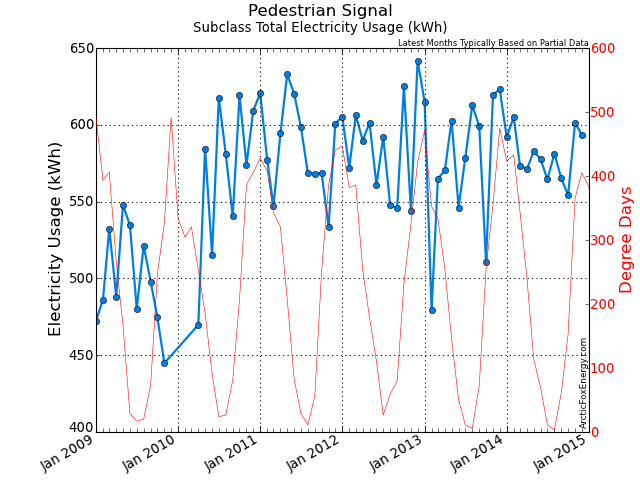
Monthly Electricity Data
| Date | Adj Elec Usage (kWh) | Read Usage (kWh) | Elec Cost ($) | Demand Cost ($) | PF Cost ($) | Total Elec Cost ($) | GHG (tCO2e) |
|---|---|---|---|---|---|---|---|
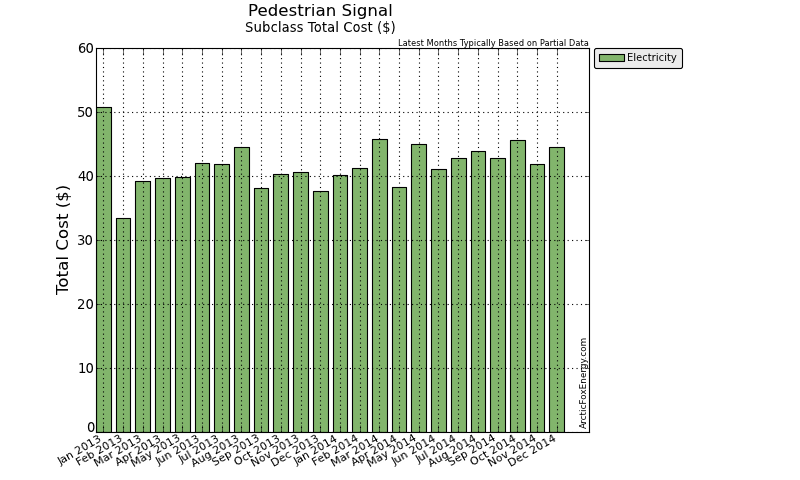
| Jan 2013 | 614.95 | 675.51 | 45.07 | 0.00 | 0.00 | 50.79 | 0.01 |
| Feb 2013 | 479.22 | 442.99 | 29.41 | 0.00 | 0.00 | 33.51 | 0.01 |
| Mar 2013 | 564.97 | 525.39 | 34.47 | 0.00 | 0.00 | 39.28 | 0.01 |
| Apr 2013 | 570.38 | 587.60 | 34.87 | 0.00 | 0.00 | 39.67 | 0.01 |
| May 2013 | 602.78 | 625.03 | 35.27 | 0.00 | 0.00 | 39.84 | 0.01 |
| Jun 2013 | 546.15 | 526.98 | 37.49 | 0.00 | 0.00 | 42.02 | 0.01 |
| Jul 2013 | 578.60 | 555.18 | 37.00 | 0.00 | 0.00 | 41.90 | 0.01 |
| Aug 2013 | 612.67 | 691.61 | 39.12 | 0.00 | 0.00 | 44.48 | 0.01 |
| Sep 2013 | 599.00 | 550.46 | 33.83 | 0.00 | 0.00 | 38.05 | 0.01 |
| Oct 2013 | 510.65 | 517.85 | 35.52 | 0.00 | 0.00 | 40.36 | 0.01 |
| Nov 2013 | 619.46 | 620.35 | 35.91 | 0.00 | 0.00 | 40.60 | 0.01 |
| Dec 2013 | 623.18 | 607.02 | 33.00 | 0.00 | 0.00 | 37.65 | 0.01 |
| Jan 2014 | 591.89 | 585.12 | 35.90 | 0.00 | 0.00 | 40.09 | 0.01 |
| Feb 2014 | 605.13 | 612.76 | 36.72 | 0.00 | 0.00 | 41.27 | 0.01 |
| Mar 2014 | 573.43 | 629.18 | 41.28 | 0.00 | 0.00 | 45.77 | 0.01 |
| Apr 2014 | 571.11 | 533.63 | 34.21 | 0.00 | 0.00 | 38.29 | 0.01 |
| May 2014 | 582.92 | 562.14 | 40.11 | 0.00 | 0.00 | 44.97 | 0.01 |
| Jun 2014 | 577.50 | 563.14 | 36.37 | 0.00 | 0.00 | 41.04 | 0.01 |
| Jul 2014 | 564.40 | 580.89 | 38.42 | 0.00 | 0.00 | 42.74 | 0.01 |
| Aug 2014 | 581.22 | 561.26 | 39.01 | 0.00 | 0.00 | 43.92 | 0.01 |
| Sep 2014 | 565.05 | 570.67 | 37.94 | 0.00 | 0.00 | 42.86 | 0.01 |
| Oct 2014 | 554.06 | 563.76 | 40.91 | 0.00 | 0.00 | 45.70 | 0.01 |
| Nov 2014 | 601.39 | 607.70 | 37.33 | 0.00 | 0.00 | 41.83 | 0.01 |
| Dec 2014 | 593.27 | 580.90 | 40.18 | 0.00 | 0.00 | 44.57 | 0.01 |
Download Monthly Electricity Data as a CSV file for import into Excel.
Yearly Data
| Date | Gas Usage (GJ) | Total Gas Cost ($) | Elec Usage (kWh) | Total Elec Cost ($) | Total Usage (ekWh) | Total Cost ($) | GHG (tCO2e) |
|---|---|---|---|---|---|---|---|
| 2009 | 0.00 | 0.00 | 5,480.61 | 376.98 | 5,480.61 | 376.98 | 0.14 |
| 2010 | 0.00 | 0.00 | 5,110.68 | 367.57 | 5,110.68 | 367.57 | 0.13 |
| 2011 | 0.00 | 0.00 | 7,030.33 | 469.64 | 7,030.33 | 469.64 | 0.18 |
| 2012 | 0.00 | 0.00 | 7,032.12 | 496.24 | 7,032.12 | 496.24 | 0.18 |
| 2013 | 0.00 | 0.00 | 6,922.03 | 488.15 | 6,922.03 | 488.15 | 0.10 |
| 2014 | 0.00 | 0.00 | 6,961.35 | 513.05 | 6,961.35 | 513.05 | 0.07 |
Download Yearly Data as a CSV file for import into Excel.
Notes
Please view the Report Notes page for important details about this report.
If any data appears unusual, please contact info@ArcticFoxEnergy.com for a manual verification. If any anomalies are detected, they will be immediately corrected.
