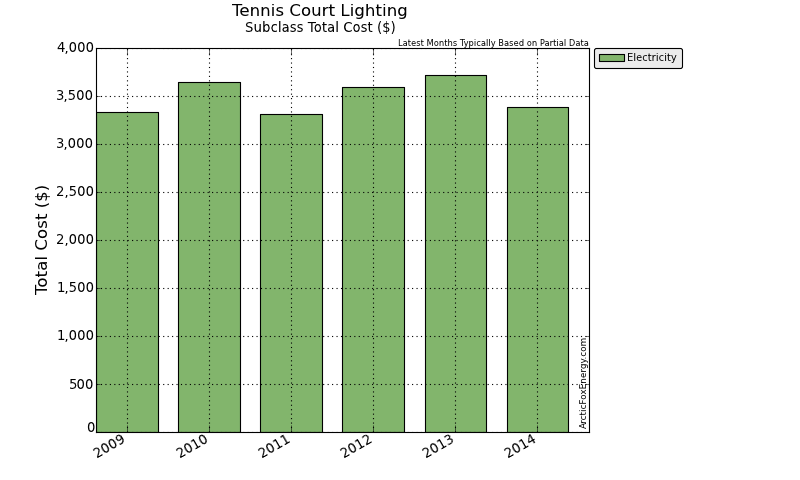
Tennis Court Lighting Subclass Total
Details
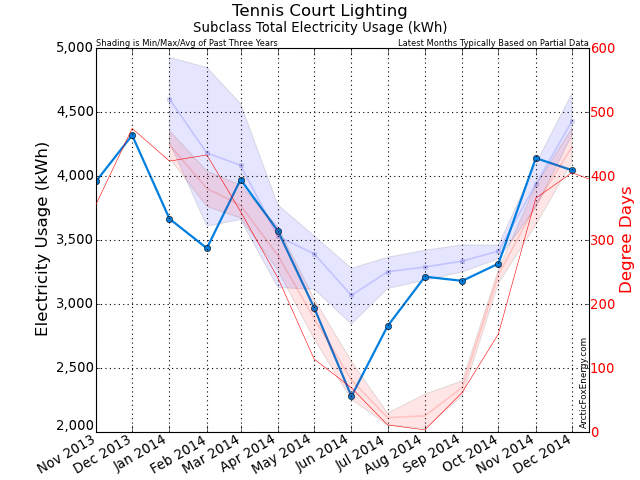
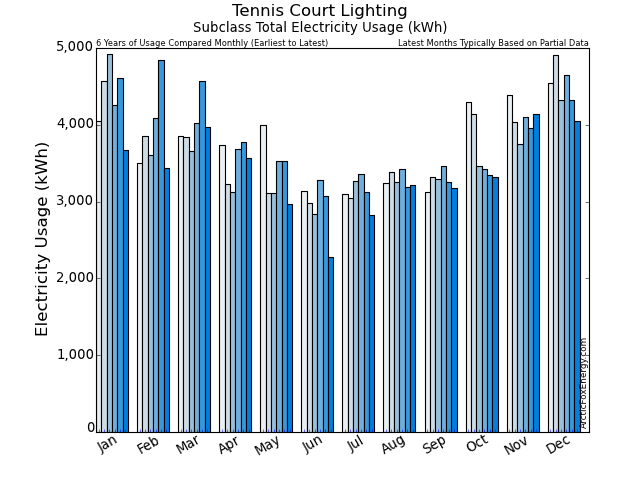
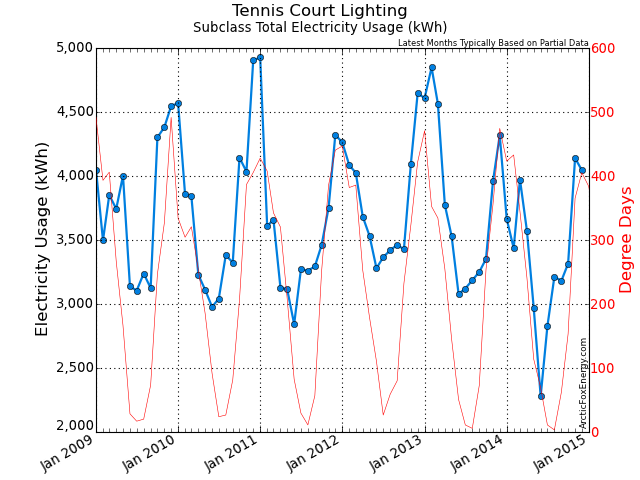
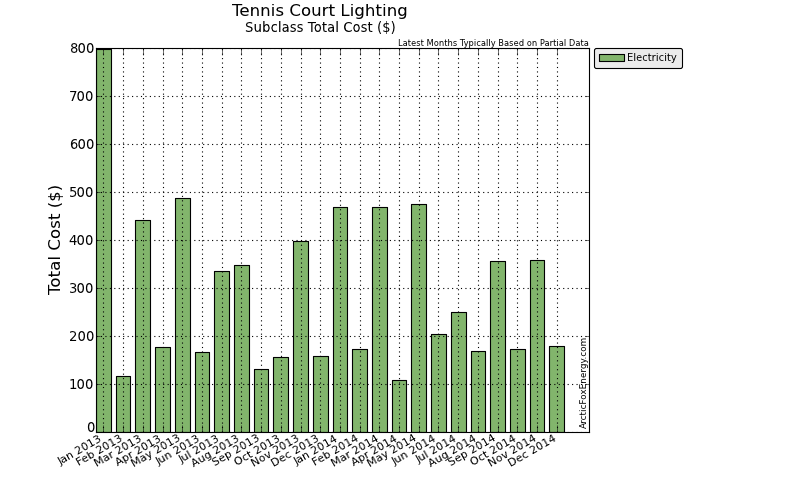
This page presents the totals for all accounts in the Tennis Court Lighting subclass.
Monthly Electricity Data
| Date | Adj Elec Usage (kWh) | Read Usage (kWh) | Elec Cost ($) | Demand Cost ($) | PF Cost ($) | Total Elec Cost ($) | GHG (tCO2e) |
|---|---|---|---|---|---|---|---|
| Jan 2013 | 4,609.29 | 9,226.47 | 709.92 | 0.00 | 0.00 | 798.83 | 0.06 |
| Feb 2013 | 4,848.10 | 1,468.45 | 104.08 | 0.00 | 0.00 | 116.82 | 0.07 |
| Mar 2013 | 4,564.72 | 6,135.92 | 391.11 | 0.00 | 0.00 | 442.52 | 0.06 |
| Apr 2013 | 3,773.96 | 2,155.63 | 156.39 | 0.00 | 0.00 | 176.15 | 0.05 |
| May 2013 | 3,530.44 | 5,594.15 | 435.74 | 0.00 | 0.00 | 486.77 | 0.05 |
| Jun 2013 | 3,078.43 | 1,916.26 | 146.23 | 0.00 | 0.00 | 165.90 | 0.04 |
| Jul 2013 | 3,121.03 | 4,246.11 | 294.31 | 0.00 | 0.00 | 335.66 | 0.04 |
| Aug 2013 | 3,185.48 | 4,585.63 | 307.11 | 0.00 | 0.00 | 348.72 | 0.04 |
| Sep 2013 | 3,250.49 | 1,802.92 | 116.73 | 0.00 | 0.00 | 132.11 | 0.05 |
| Oct 2013 | 3,352.25 | 1,945.66 | 135.51 | 0.00 | 0.00 | 156.95 | 0.05 |
| Nov 2013 | 3,958.09 | 4,933.16 | 354.42 | 0.00 | 0.00 | 398.07 | 0.06 |
| Dec 2013 | 4,318.70 | 2,159.55 | 136.28 | 0.00 | 0.00 | 158.10 | 0.06 |
| Jan 2014 | 3,665.51 | 6,016.84 | 416.81 | 0.00 | 0.00 | 469.20 | 0.04 |
| Feb 2014 | 3,435.54 | 1,962.77 | 157.13 | 0.00 | 0.00 | 173.65 | 0.03 |
| Mar 2014 | 3,972.45 | 6,013.72 | 416.09 | 0.00 | 0.00 | 469.67 | 0.04 |
| Apr 2014 | 3,570.65 | 1,207.95 | 96.04 | 0.00 | 0.00 | 108.39 | 0.04 |
| May 2014 | 2,971.94 | 5,582.95 | 423.42 | 0.00 | 0.00 | 475.36 | 0.03 |
| Jun 2014 | 2,279.18 | 1,950.09 | 183.13 | 0.00 | 0.00 | 203.56 | 0.02 |
| Jul 2014 | 2,827.24 | 2,686.48 | 223.81 | 0.00 | 0.00 | 250.01 | 0.03 |
| Aug 2014 | 3,213.56 | 2,240.04 | 146.80 | 0.00 | 0.00 | 167.77 | 0.03 |
| Sep 2014 | 3,180.80 | 4,054.54 | 319.46 | 0.00 | 0.00 | 355.53 | 0.03 |
| Oct 2014 | 3,315.40 | 2,421.35 | 153.85 | 0.00 | 0.00 | 173.93 | 0.03 |
| Nov 2014 | 4,139.86 | 4,207.34 | 320.52 | 0.00 | 0.00 | 358.47 | 0.04 |
| Dec 2014 | 4,045.35 | 1,938.52 | 158.62 | 0.00 | 0.00 | 179.74 | 0.04 |
Download Monthly Electricity Data as a CSV file for import into Excel.
Yearly Data
| Date | Gas Usage (GJ) | Total Gas Cost ($) | Elec Usage (kWh) | Total Elec Cost ($) | Total Usage (ekWh) | Total Cost ($) | GHG (tCO2e) |
|---|---|---|---|---|---|---|---|
| 2009 | 0.00 | 0.00 | 44,978.25 | 3,330.85 | 44,978.25 | 3,330.85 | 1.17 |
| 2010 | 0.00 | 0.00 | 44,416.09 | 3,640.71 | 44,416.09 | 3,640.71 | 1.15 |
| 2011 | 0.00 | 0.00 | 42,635.16 | 3,309.14 | 42,635.16 | 3,309.14 | 1.07 |
| 2012 | 0.00 | 0.00 | 45,283.20 | 3,590.25 | 45,283.20 | 3,590.25 | 1.13 |
| 2013 | 0.00 | 0.00 | 45,590.99 | 3,716.60 | 45,590.99 | 3,716.60 | 0.64 |
| 2014 | 0.00 | 0.00 | 40,617.48 | 3,385.25 | 40,617.48 | 3,385.25 | 0.41 |
Download Yearly Data as a CSV file for import into Excel.
Notes
Please view the Report Notes page for important details about this report.
If any data appears unusual, please contact info@ArcticFoxEnergy.com for a manual verification. If any anomalies are detected, they will be immediately corrected.
