Fire Services Subclass Total
Details
This page presents the totals for all accounts in the Fire Services subclass.
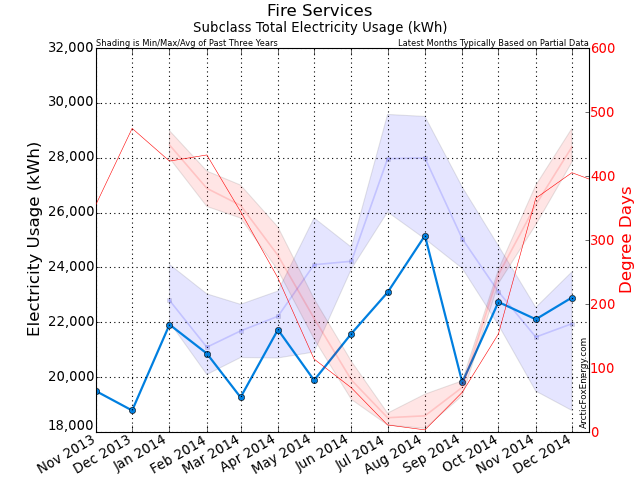
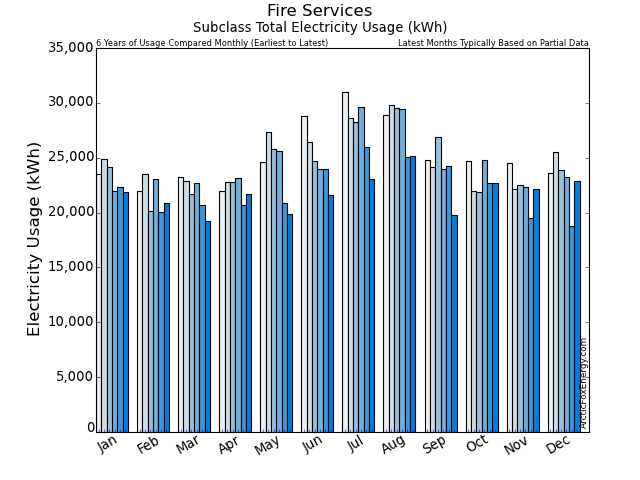
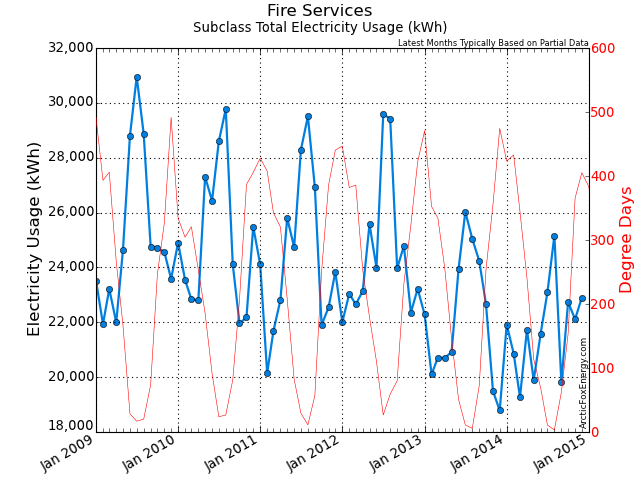
Monthly Electricity Data
| Date | Adj Elec Usage (kWh) | Read Usage (kWh) | Elec Cost ($) | Demand Cost ($) | PF Cost ($) | Total Elec Cost ($) | GHG (tCO2e) |
|---|---|---|---|---|---|---|---|
| Jan 2013 | 22,286.09 | 25,732.58 | 1,421.51 | 33.97 | 0.00 | 1,661.39 | 0.31 |
| Feb 2013 | 20,096.66 | 20,131.56 | 1,292.71 | 54.02 | 0.00 | 1,509.11 | 0.28 |
| Mar 2013 | 20,715.37 | 19,374.86 | 1,177.70 | 64.44 | 0.00 | 1,411.15 | 0.29 |
| Apr 2013 | 20,699.60 | 21,476.62 | 1,252.32 | 84.53 | 0.00 | 1,516.05 | 0.29 |
| May 2013 | 20,916.17 | 23,309.02 | 1,574.74 | 96.18 | 0.00 | 1,867.65 | 0.29 |
| Jun 2013 | 23,947.40 | 21,125.45 | 1,250.99 | 104.83 | 0.00 | 1,535.33 | 0.34 |
| Jul 2013 | 26,021.99 | 27,209.28 | 1,610.01 | 124.67 | 0.00 | 1,944.19 | 0.36 |
| Aug 2013 | 25,040.63 | 24,260.21 | 1,613.03 | 111.17 | 0.00 | 1,919.25 | 0.35 |
| Sep 2013 | 24,232.21 | 25,158.53 | 1,267.99 | 91.86 | 0.00 | 1,549.50 | 0.34 |
| Oct 2013 | 22,655.18 | 21,317.83 | 1,349.42 | 81.09 | 0.00 | 1,599.11 | 0.32 |
| Nov 2013 | 19,491.04 | 23,114.05 | 1,387.66 | 49.09 | 0.00 | 1,622.94 | 0.27 |
| Dec 2013 | 18,784.79 | 16,944.89 | 1,054.10 | 49.45 | 0.00 | 1,270.37 | 0.26 |
| Jan 2014 | 21,916.60 | 20,683.64 | 1,258.45 | 38.40 | 0.00 | 1,436.70 | 0.22 |
| Feb 2014 | 20,860.81 | 20,002.43 | 1,175.11 | 36.25 | 0.00 | 1,352.66 | 0.21 |
| Mar 2014 | 19,264.04 | 21,030.18 | 1,253.08 | 56.89 | 0.00 | 1,483.72 | 0.19 |
| Apr 2014 | 21,731.33 | 21,105.74 | 1,167.49 | 87.81 | 0.00 | 1,420.08 | 0.22 |
| May 2014 | 19,885.80 | 20,614.02 | 1,465.97 | 127.73 | 0.00 | 1,788.88 | 0.20 |
| Jun 2014 | 21,590.42 | 20,481.53 | 1,257.60 | 106.40 | 0.00 | 1,520.60 | 0.22 |
| Jul 2014 | 23,089.30 | 21,918.05 | 1,682.08 | 117.16 | 0.00 | 2,005.55 | 0.23 |
| Aug 2014 | 25,159.30 | 25,963.15 | 1,422.73 | 126.17 | 0.00 | 1,732.85 | 0.25 |
| Sep 2014 | 19,806.99 | 20,604.45 | 1,390.57 | 94.33 | 0.00 | 1,683.29 | 0.20 |
| Oct 2014 | 22,739.58 | 22,847.07 | 1,366.22 | 100.03 | 0.00 | 1,636.40 | 0.23 |
| Nov 2014 | 22,108.68 | 23,217.74 | 1,401.56 | 0.00 | 0.00 | 1,584.10 | 0.22 |
| Dec 2014 | 22,902.35 | 18,436.87 | 1,156.93 | 0.00 | 0.00 | 1,299.69 | 0.23 |
Download Monthly Electricity Data as a CSV file for import into Excel.
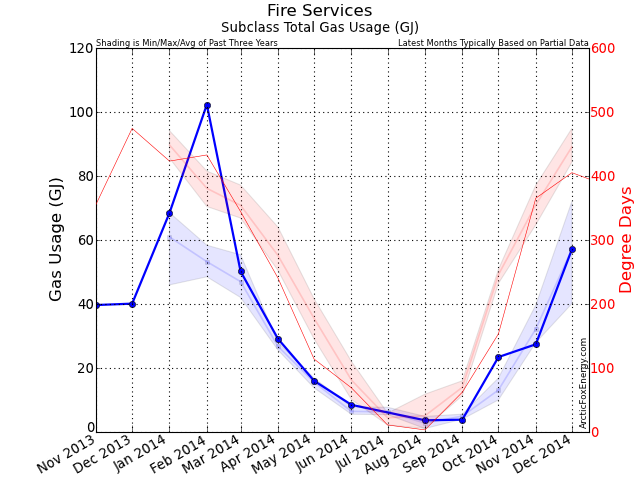
Monthly Gas Data
| Date | Adj Gas Usage (GJ) | Read Usage (GJ) | Gas Cost ($) | Basic / Mgmt Cost ($) | Delivery Cost ($) | Midstream Cost ($) | Total Gas Cost ($) | GHG (tCO2e) |
|---|---|---|---|---|---|---|---|---|
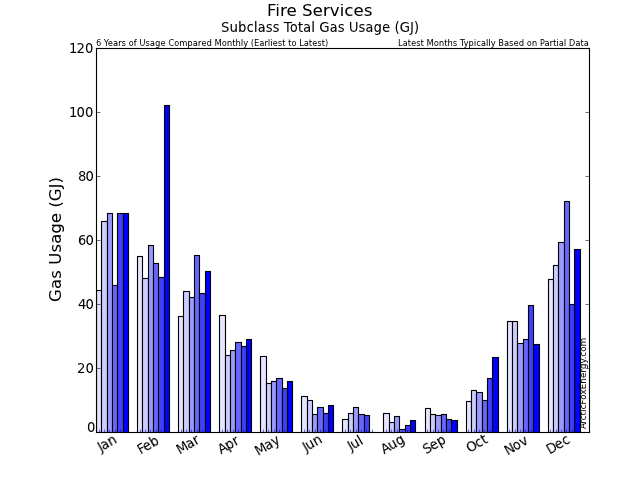
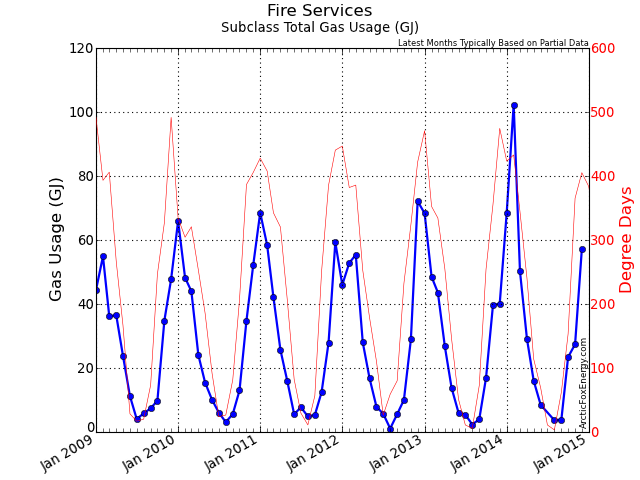
| Jan 2013 | 68.35 | 68.35 | 833.19 | 56.65 | 0.00 | 0.00 | 889.85 | 3.40 |
| Feb 2013 | 48.50 | 48.50 | 584.21 | 52.19 | 0.00 | 0.00 | 636.40 | 2.41 |
| Mar 2013 | 43.58 | 43.58 | 561.02 | 57.20 | 0.00 | 0.00 | 618.22 | 2.17 |
| Apr 2013 | 26.73 | 26.73 | 313.39 | 49.22 | 0.00 | 0.00 | 362.60 | 1.33 |
| May 2013 | 13.78 | 13.78 | 175.78 | 46.73 | 0.00 | 0.00 | 222.51 | 0.69 |
| Jun 2013 | 5.96 | 5.96 | 81.65 | 48.66 | 0.00 | 0.00 | 130.30 | 0.30 |
| Jul 2013 | 5.42 | 5.42 | 65.59 | 52.24 | 0.00 | 0.00 | 117.83 | 0.27 |
| Aug 2013 | 2.33 | 2.33 | 28.27 | 48.68 | 0.00 | 0.00 | 76.95 | 0.12 |
| Sep 2013 | 3.99 | 3.99 | 58.07 | 52.49 | 0.00 | 0.00 | 110.56 | 0.20 |
| Oct 2013 | 16.86 | 16.86 | 195.12 | 47.01 | 0.00 | 0.00 | 242.13 | 0.84 |
| Nov 2013 | 39.67 | 39.67 | 463.06 | 54.50 | 0.00 | 0.00 | 517.56 | 1.97 |
| Dec 2013 | 40.11 | 40.11 | 460.72 | 26.12 | 0.00 | 0.00 | 486.83 | 2.00 |
| Jan 2014 | 68.47 | 64.81 | 680.33 | 47.33 | 0.00 | 0.00 | 727.66 | 3.41 |
| Feb 2014 | 102.33 | 105.98 | 1,239.26 | 77.19 | 0.00 | 0.00 | 1,316.45 | 5.09 |
| Mar 2014 | 50.19 | 50.19 | 598.31 | 52.98 | 0.00 | 0.00 | 651.29 | 2.50 |
| Apr 2014 | 29.13 | 29.13 | 344.73 | 51.65 | 0.00 | 0.00 | 396.38 | 1.45 |
| May 2014 | 16.00 | 16.00 | 183.50 | 54.84 | 0.00 | 0.00 | 238.33 | 0.80 |
| Jun 2014 | 8.49 | 8.49 | 94.95 | 52.35 | 0.00 | 0.00 | 147.29 | 0.42 |
| Jul 2014 | 0.00 | 0.00 | 0.00 | 0.00 | 0.00 | 0.00 | 0.00 | 0.00 |
| Aug 2014 | 3.66 | 3.66 | 39.70 | 76.92 | 0.00 | 0.00 | 116.61 | 0.18 |
| Sep 2014 | 3.85 | 3.85 | 49.31 | 50.95 | 0.00 | 0.00 | 100.26 | 0.19 |
| Oct 2014 | 23.42 | 11.04 | 139.33 | 53.17 | 0.00 | 0.00 | 192.50 | 1.17 |
| Nov 2014 | 27.41 | 21.34 | 174.58 | 46.29 | 48.91 | 27.16 | 340.89 | 1.36 |
| Dec 2014 | 57.09 | 51.55 | 386.52 | 44.94 | 124.92 | 76.00 | 746.63 | 2.84 |
Download Monthly Gas Data as a CSV file for import into Excel.
Monthly Total Data
| Date | Adj Gas Usage (GJ) | Total Gas Cost ($) | Adj Elec Usage (kWh) | Total Elec Cost ($) | Total Usage (ekWh) | Total Cost ($) | GHG (tCO2e) |
|---|---|---|---|---|---|---|---|
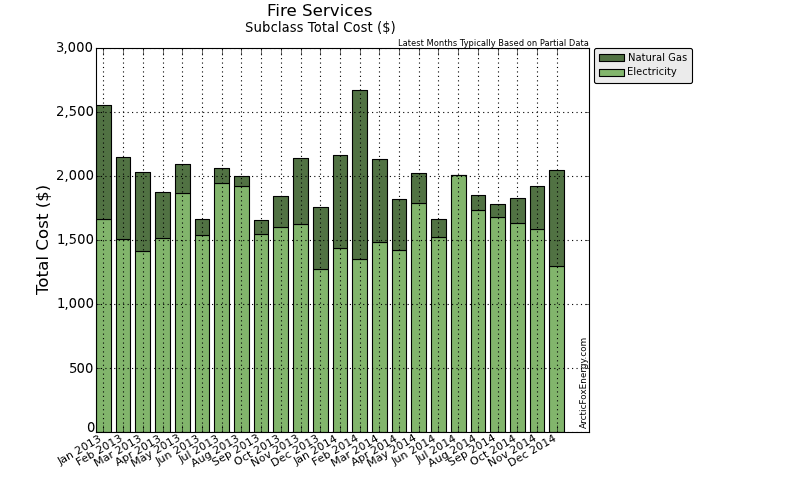
| Jan 2013 | 68.35 | 889.85 | 22,286.09 | 1,661.39 | 41,272.91 | 2,551.23 | 3.71 |
| Feb 2013 | 48.50 | 636.40 | 20,096.66 | 1,509.11 | 33,568.45 | 2,145.50 | 2.69 |
| Mar 2013 | 43.58 | 618.22 | 20,715.37 | 1,411.15 | 32,821.96 | 2,029.37 | 2.46 |
| Apr 2013 | 26.73 | 362.60 | 20,699.60 | 1,516.05 | 28,123.28 | 1,878.65 | 1.62 |
| May 2013 | 13.78 | 222.51 | 20,916.17 | 1,867.65 | 24,744.55 | 2,090.16 | 0.98 |
| Jun 2013 | 5.96 | 130.30 | 23,947.40 | 1,535.33 | 25,603.11 | 1,665.64 | 0.63 |
| Jul 2013 | 5.42 | 117.83 | 26,021.99 | 1,944.19 | 27,528.29 | 2,062.02 | 0.63 |
| Aug 2013 | 2.33 | 76.95 | 25,040.63 | 1,919.25 | 25,688.33 | 1,996.20 | 0.47 |
| Sep 2013 | 3.99 | 110.56 | 24,232.21 | 1,549.50 | 25,341.40 | 1,660.06 | 0.54 |
| Oct 2013 | 16.86 | 242.13 | 22,655.18 | 1,599.11 | 27,339.30 | 1,841.24 | 1.16 |
| Nov 2013 | 39.67 | 517.56 | 19,491.04 | 1,622.94 | 30,511.76 | 2,140.49 | 2.25 |
| Dec 2013 | 40.11 | 486.83 | 18,784.79 | 1,270.37 | 29,927.26 | 1,757.21 | 2.26 |
| Jan 2014 | 68.47 | 727.66 | 21,916.60 | 1,436.70 | 40,934.95 | 2,164.36 | 3.63 |
| Feb 2014 | 102.33 | 1,316.45 | 20,860.81 | 1,352.66 | 49,285.79 | 2,669.11 | 5.30 |
| Mar 2014 | 50.19 | 651.29 | 19,264.04 | 1,483.72 | 33,206.69 | 2,135.01 | 2.69 |
| Apr 2014 | 29.13 | 396.38 | 21,731.33 | 1,420.08 | 29,823.07 | 1,816.46 | 1.67 |
| May 2014 | 16.00 | 238.33 | 19,885.80 | 1,788.88 | 24,331.38 | 2,027.21 | 1.00 |
| Jun 2014 | 8.49 | 147.29 | 21,590.42 | 1,520.60 | 23,947.38 | 1,667.89 | 0.64 |
| Jul 2014 | 0.00 | 0.00 | 23,089.30 | 2,005.55 | 23,089.30 | 2,005.55 | 0.23 |
| Aug 2014 | 3.66 | 116.61 | 25,159.30 | 1,732.85 | 26,176.42 | 1,849.46 | 0.43 |
| Sep 2014 | 3.85 | 100.26 | 19,806.99 | 1,683.29 | 20,875.55 | 1,783.55 | 0.39 |
| Oct 2014 | 23.42 | 192.50 | 22,739.58 | 1,636.40 | 29,244.97 | 1,828.90 | 1.39 |
| Nov 2014 | 27.41 | 340.89 | 22,108.68 | 1,584.10 | 29,721.52 | 1,924.99 | 1.58 |
| Dec 2014 | 57.09 | 746.63 | 22,902.35 | 1,299.69 | 38,760.21 | 2,046.33 | 3.07 |
Download Monthly Total Data as a CSV file for import into Excel.
Yearly Data
| Date | Gas Usage (GJ) | Total Gas Cost ($) | Elec Usage (kWh) | Total Elec Cost ($) | Total Usage (ekWh) | Total Cost ($) | GHG (tCO2e) |
|---|---|---|---|---|---|---|---|
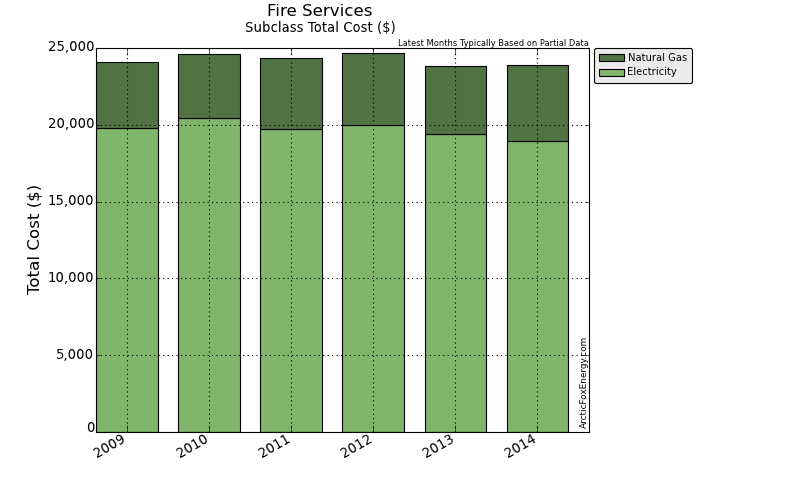
| 2009 | 316.53 | 4,296.74 | 301,558.22 | 19,764.63 | 389,482.04 | 24,061.37 | 23.59 |
| 2010 | 322.43 | 4,146.49 | 299,920.70 | 20,433.97 | 389,483.93 | 24,580.45 | 23.84 |
| 2011 | 333.78 | 4,654.78 | 292,305.48 | 19,704.56 | 385,022.59 | 24,359.34 | 23.91 |
| 2012 | 330.34 | 4,734.98 | 293,733.11 | 19,967.59 | 385,494.76 | 24,702.57 | 23.78 |
| 2013 | 315.30 | 4,411.74 | 264,887.12 | 19,406.03 | 352,470.58 | 23,817.78 | 19.39 |
| 2014 | 390.03 | 4,974.31 | 261,055.20 | 18,944.50 | 369,397.22 | 23,918.81 | 22.01 |
Download Yearly Data as a CSV file for import into Excel.
Metrics
Hours of Usage per Year: 8760 hours
| Date | Usage per Hour (ekWh/h) |
|---|---|
| 2009 | 44.46 |
| 2010 | 44.46 |
| 2011 | 43.95 |
| 2012 | 44.01 |
| 2013 | 40.24 |
| 2014 | 42.17 |
Download Metric Data as a CSV file for import into Excel.
Notes
Please view the Report Notes page for important details about this report.
If any data appears unusual, please contact info@ArcticFoxEnergy.com for a manual verification. If any anomalies are detected, they will be immediately corrected.
