Community Centre Subclass Total
Details
This page presents the totals for all accounts in the Community Centre subclass.
Monthly Electricity Data
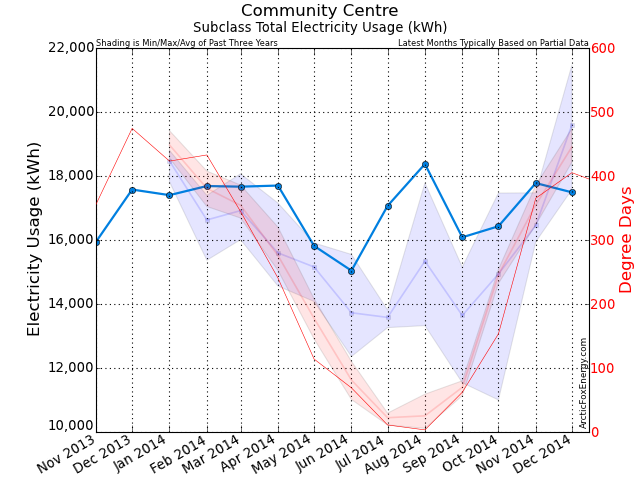
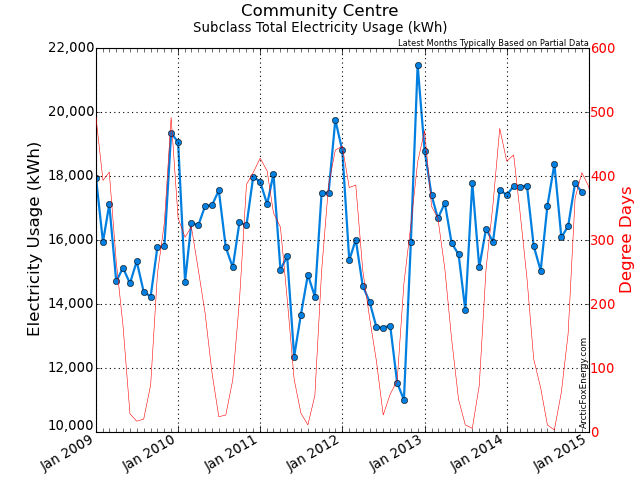
| Date | Adj Elec Usage (kWh) | Read Usage (kWh) | Elec Cost ($) | Demand Cost ($) | PF Cost ($) | Total Elec Cost ($) | GHG (tCO2e) |
|---|---|---|---|---|---|---|---|
| Jan 2013 | 18,791.94 | 18,946.95 | 1,279.03 | 3.85 | 0.00 | 1,456.73 | 0.26 |
| Feb 2013 | 17,395.77 | 18,260.48 | 1,316.42 | 0.00 | 0.00 | 1,473.93 | 0.24 |
| Mar 2013 | 16,676.84 | 12,777.85 | 1,011.98 | 0.00 | 0.00 | 1,127.21 | 0.23 |
| Apr 2013 | 17,154.27 | 5,700.05 | 341.21 | 0.00 | 0.00 | 388.32 | 0.24 |
| May 2013 | 15,906.84 | 27,848.78 | 1,733.53 | 0.00 | 0.00 | 1,962.20 | 0.22 |
| Jun 2013 | 15,549.68 | 18,268.36 | 1,267.72 | 3.35 | 0.00 | 1,422.04 | 0.22 |
| Jul 2013 | 13,813.45 | 11,824.28 | 925.43 | 0.00 | 0.00 | 1,042.67 | 0.19 |
| Aug 2013 | 17,783.65 | 20,229.16 | 1,391.77 | 3.97 | 0.00 | 1,568.62 | 0.25 |
| Sep 2013 | 15,152.13 | 0.00 | 0.00 | 0.00 | 0.00 | 0.00 | 0.21 |
| Oct 2013 | 16,343.80 | 31,835.59 | 2,212.80 | 3.53 | 0.00 | 2,501.67 | 0.23 |
| Nov 2013 | 15,944.24 | 13,346.23 | 834.18 | 0.00 | 0.00 | 945.55 | 0.22 |
| Dec 2013 | 17,576.46 | 5,369.24 | 350.81 | 0.00 | 0.00 | 401.37 | 0.25 |
| Jan 2014 | 17,401.79 | 28,665.27 | 2,015.97 | 0.00 | 0.00 | 2,260.17 | 0.17 |
| Feb 2014 | 17,686.30 | 20,662.31 | 1,346.01 | 0.00 | 0.00 | 1,522.13 | 0.18 |
| Mar 2014 | 17,666.78 | 2,721.36 | 192.49 | 0.00 | 0.00 | 216.28 | 0.18 |
| Apr 2014 | 17,701.35 | 33,224.89 | 2,208.91 | 7.56 | 0.00 | 2,490.79 | 0.18 |
| May 2014 | 15,816.02 | 12,670.76 | 998.32 | 0.00 | 0.00 | 1,114.68 | 0.16 |
| Jun 2014 | 15,041.99 | 16,614.42 | 1,268.56 | 0.00 | 0.00 | 1,421.95 | 0.15 |
| Jul 2014 | 17,067.13 | 15,322.14 | 1,012.70 | 0.00 | 0.00 | 1,144.45 | 0.17 |
| Aug 2014 | 18,374.41 | 20,602.99 | 1,485.36 | 0.00 | 0.00 | 1,679.98 | 0.18 |
| Sep 2014 | 16,084.45 | 14,239.06 | 1,101.57 | 0.00 | 0.00 | 1,105.89 | 0.16 |
| Oct 2014 | 16,428.96 | 18,610.67 | 1,501.41 | 0.00 | 0.00 | 1,558.44 | 0.16 |
| Nov 2014 | 17,778.64 | 0.00 | 0.00 | 0.00 | 0.00 | 0.00 | 0.18 |
| Dec 2014 | 17,489.48 | 33,819.15 | 2,700.70 | 0.00 | 0.00 | 3,215.72 | 0.17 |
Download Monthly Electricity Data as a CSV file for import into Excel.
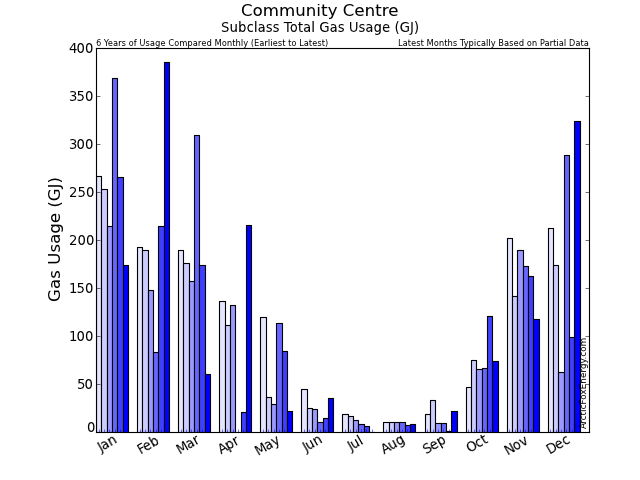
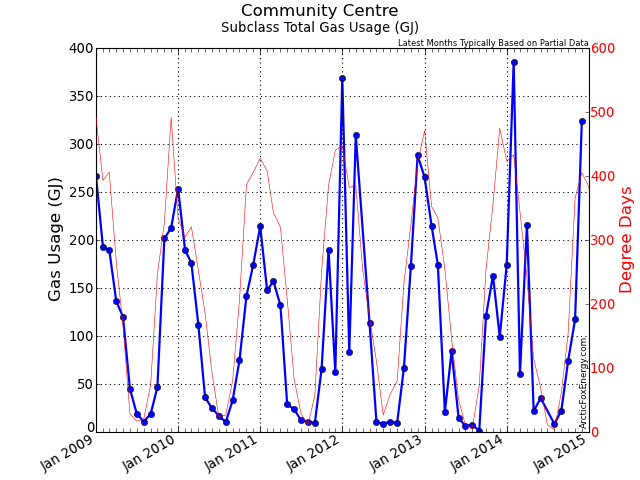
Monthly Gas Data
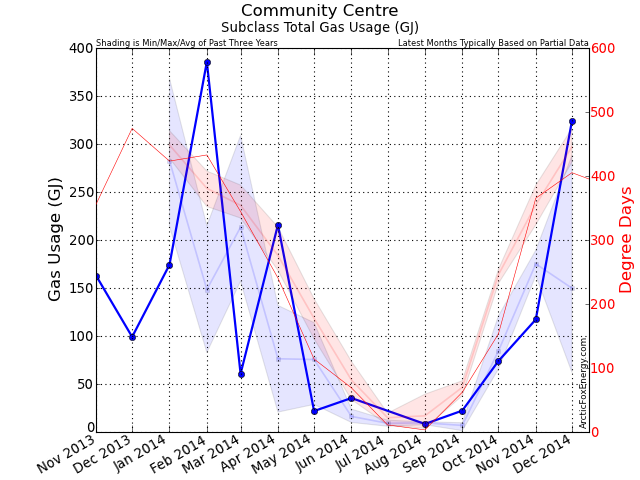
| Date | Adj Gas Usage (GJ) | Read Usage (GJ) | Gas Cost ($) | Basic / Mgmt Cost ($) | Delivery Cost ($) | Midstream Cost ($) | Total Gas Cost ($) | GHG (tCO2e) |
|---|---|---|---|---|---|---|---|---|
| Jan 2013 | 265.23 | 265.23 | 3,262.60 | 49.49 | 0.00 | 0.00 | 3,312.09 | 13.20 |
| Feb 2013 | 214.77 | 214.77 | 2,484.92 | 54.00 | 0.00 | 0.00 | 2,538.92 | 10.68 |
| Mar 2013 | 174.11 | 174.11 | 1,982.54 | 52.11 | 0.00 | 0.00 | 2,034.64 | 8.66 |
| Apr 2013 | 20.75 | 20.75 | 254.16 | 26.08 | 0.00 | 0.00 | 280.24 | 1.03 |
| May 2013 | 83.93 | 83.93 | 1,095.48 | 81.66 | 0.00 | 0.00 | 1,177.15 | 4.18 |
| Jun 2013 | 15.01 | 15.01 | 167.63 | 52.15 | 0.00 | 0.00 | 219.78 | 0.75 |
| Jul 2013 | 6.02 | 6.02 | 74.67 | 50.49 | 0.00 | 0.00 | 125.16 | 0.30 |
| Aug 2013 | 7.59 | 7.59 | 86.79 | 48.86 | 0.00 | 0.00 | 135.66 | 0.38 |
| Sep 2013 | 1.43 | 1.43 | 15.13 | 23.16 | 0.00 | 0.00 | 38.29 | 0.07 |
| Oct 2013 | 120.87 | 120.87 | 1,531.44 | 82.54 | 0.00 | 0.00 | 1,613.98 | 6.01 |
| Nov 2013 | 163.00 | 163.00 | 1,986.73 | 53.05 | 0.00 | 0.00 | 2,039.78 | 8.11 |
| Dec 2013 | 99.09 | 99.09 | 1,211.04 | 25.79 | 0.00 | 0.00 | 1,236.84 | 4.93 |
| Jan 2014 | 174.24 | 160.47 | 2,328.47 | 23.57 | 0.00 | 0.00 | 2,352.04 | 8.67 |
| Feb 2014 | 385.60 | 399.37 | 5,205.51 | 102.27 | 0.00 | 0.00 | 5,307.78 | 19.18 |
| Mar 2014 | 60.66 | 60.66 | 737.87 | 25.27 | 0.00 | 0.00 | 763.14 | 3.02 |
| Apr 2014 | 215.80 | 215.80 | 2,822.59 | 82.05 | 0.00 | 0.00 | 2,904.64 | 10.74 |
| May 2014 | 21.83 | 21.83 | 263.61 | 55.87 | 0.00 | 0.00 | 319.48 | 1.09 |
| Jun 2014 | 35.37 | 35.37 | 443.92 | 49.54 | 0.00 | 0.00 | 493.46 | 1.76 |
| Jul 2014 | 0.00 | 0.00 | 0.00 | 0.00 | 0.00 | 0.00 | 0.00 | 0.00 |
| Aug 2014 | 8.35 | 8.35 | 108.25 | 49.01 | 0.00 | 0.00 | 157.26 | 0.42 |
| Sep 2014 | 22.26 | 22.26 | 299.16 | 56.01 | 0.00 | 0.00 | 355.17 | 1.11 |
| Oct 2014 | 73.94 | 68.58 | 969.52 | 53.40 | 0.00 | 0.00 | 1,022.92 | 3.68 |
| Nov 2014 | 117.19 | 46.91 | 352.95 | 21.96 | 120.03 | 68.31 | 663.49 | 5.83 |
| Dec 2014 | 323.93 | 390.28 | 2,750.27 | 68.81 | 910.90 | 539.58 | 5,027.22 | 16.12 |
Download Monthly Gas Data as a CSV file for import into Excel.
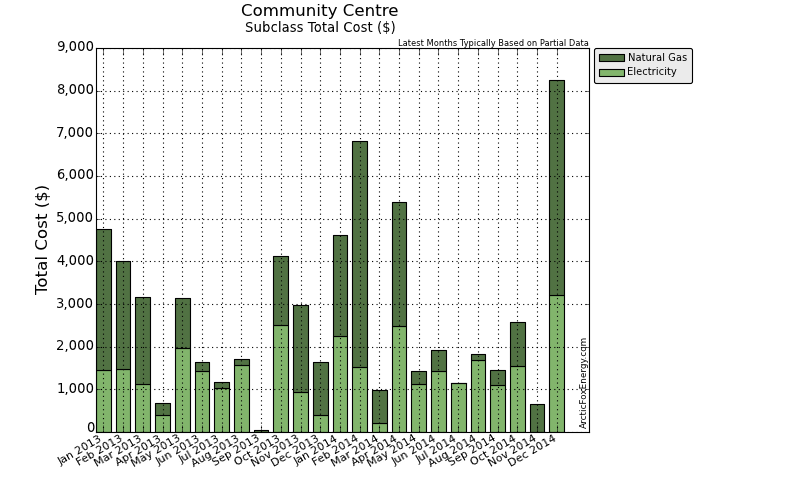
Monthly Total Data
| Date | Adj Gas Usage (GJ) | Total Gas Cost ($) | Adj Elec Usage (kWh) | Total Elec Cost ($) | Total Usage (ekWh) | Total Cost ($) | GHG (tCO2e) |
|---|---|---|---|---|---|---|---|
| Jan 2013 | 265.23 | 3,312.09 | 18,791.94 | 1,456.73 | 92,467.38 | 4,768.82 | 13.46 |
| Feb 2013 | 214.77 | 2,538.92 | 17,395.77 | 1,473.93 | 77,053.23 | 4,012.85 | 10.93 |
| Mar 2013 | 174.11 | 2,034.64 | 16,676.84 | 1,127.21 | 65,040.38 | 3,161.86 | 8.90 |
| Apr 2013 | 20.75 | 280.24 | 17,154.27 | 388.32 | 22,918.85 | 668.56 | 1.27 |
| May 2013 | 83.93 | 1,177.15 | 15,906.84 | 1,962.20 | 39,221.48 | 3,139.35 | 4.40 |
| Jun 2013 | 15.01 | 219.78 | 15,549.68 | 1,422.04 | 19,719.90 | 1,641.81 | 0.96 |
| Jul 2013 | 6.02 | 125.16 | 13,813.45 | 1,042.67 | 15,486.50 | 1,167.84 | 0.49 |
| Aug 2013 | 7.59 | 135.66 | 17,783.65 | 1,568.62 | 19,892.90 | 1,704.27 | 0.63 |
| Sep 2013 | 1.43 | 38.29 | 15,152.13 | 0.00 | 15,550.10 | 38.29 | 0.28 |
| Oct 2013 | 120.87 | 1,613.98 | 16,343.80 | 2,501.67 | 49,918.99 | 4,115.66 | 6.24 |
| Nov 2013 | 163.00 | 2,039.78 | 15,944.24 | 945.55 | 61,222.55 | 2,985.32 | 8.33 |
| Dec 2013 | 99.09 | 1,236.84 | 17,576.46 | 401.37 | 45,101.03 | 1,638.20 | 5.18 |
| Jan 2014 | 174.24 | 2,352.04 | 17,401.79 | 2,260.17 | 65,802.58 | 4,612.21 | 8.84 |
| Feb 2014 | 385.60 | 5,307.78 | 17,686.30 | 1,522.13 | 124,796.34 | 6,829.91 | 19.36 |
| Mar 2014 | 60.66 | 763.14 | 17,666.78 | 216.28 | 34,516.24 | 979.42 | 3.19 |
| Apr 2014 | 215.80 | 2,904.64 | 17,701.35 | 2,490.79 | 77,645.63 | 5,395.42 | 10.91 |
| May 2014 | 21.83 | 319.48 | 15,816.02 | 1,114.68 | 21,878.70 | 1,434.15 | 1.24 |
| Jun 2014 | 35.37 | 493.46 | 15,041.99 | 1,421.95 | 24,866.88 | 1,915.41 | 1.91 |
| Jul 2014 | 0.00 | 0.00 | 17,067.13 | 1,144.45 | 17,067.13 | 1,144.45 | 0.17 |
| Aug 2014 | 8.35 | 157.26 | 18,374.41 | 1,679.98 | 20,694.86 | 1,837.24 | 0.60 |
| Sep 2014 | 22.26 | 355.17 | 16,084.45 | 1,105.89 | 22,268.26 | 1,461.06 | 1.27 |
| Oct 2014 | 73.94 | 1,022.92 | 16,428.96 | 1,558.44 | 36,968.05 | 2,581.36 | 3.84 |
| Nov 2014 | 117.19 | 663.49 | 17,778.64 | 0.00 | 50,332.67 | 663.49 | 6.01 |
| Dec 2014 | 323.93 | 5,027.22 | 17,489.48 | 3,215.72 | 107,469.17 | 8,242.94 | 16.29 |
Download Monthly Total Data as a CSV file for import into Excel.
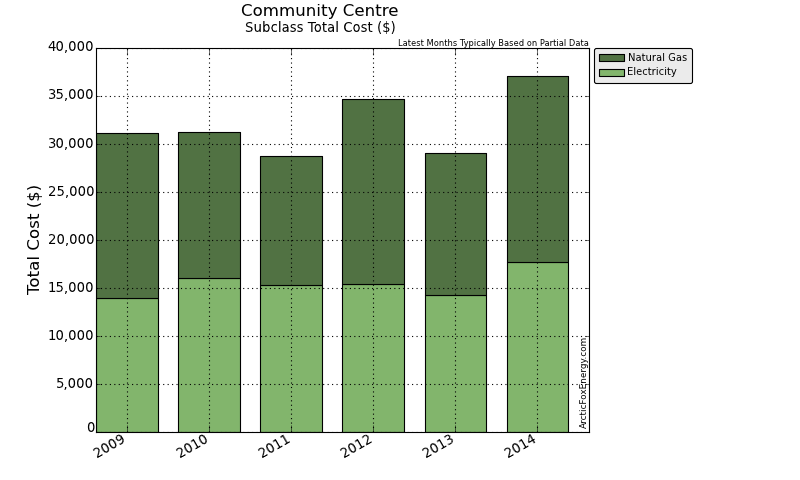
Yearly Data
| Date | Gas Usage (GJ) | Total Gas Cost ($) | Elec Usage (kWh) | Total Elec Cost ($) | Total Usage (ekWh) | Total Cost ($) | GHG (tCO2e) |
|---|---|---|---|---|---|---|---|
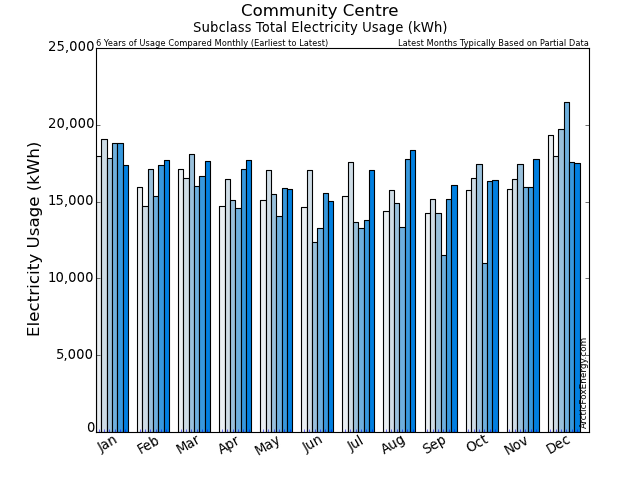
| 2009 | 1,459.40 | 17,153.52 | 190,342.12 | 14,004.97 | 595,731.95 | 31,158.49 | 77.55 |
| 2010 | 1,243.03 | 15,217.07 | 200,369.76 | 16,050.21 | 545,655.07 | 31,267.28 | 67.05 |
| 2011 | 1,052.79 | 13,429.64 | 193,438.37 | 15,342.62 | 485,881.37 | 28,772.26 | 57.21 |
| 2012 | 1,440.99 | 19,234.40 | 178,636.31 | 15,422.10 | 578,911.25 | 34,656.50 | 76.16 |
| 2013 | 1,171.82 | 14,752.52 | 198,089.07 | 14,290.31 | 523,593.28 | 29,042.83 | 61.07 |
| 2014 | 1,439.17 | 19,366.59 | 204,537.31 | 17,730.48 | 604,306.50 | 37,097.07 | 73.64 |
Download Yearly Data as a CSV file for import into Excel.
Metrics
Hours of Usage per Year: 8760 hours
| Date | Usage per Hour (ekWh/h) |
|---|---|
| 2009 | 68.01 |
| 2010 | 62.29 |
| 2011 | 55.47 |
| 2012 | 66.09 |
| 2013 | 59.77 |
| 2014 | 68.98 |
Download Metric Data as a CSV file for import into Excel.
Notes
Please view the Report Notes page for important details about this report.
If any data appears unusual, please contact info@ArcticFoxEnergy.com for a manual verification. If any anomalies are detected, they will be immediately corrected.
