Library Subclass Total
Details
This page presents the totals for all accounts in the Library subclass.
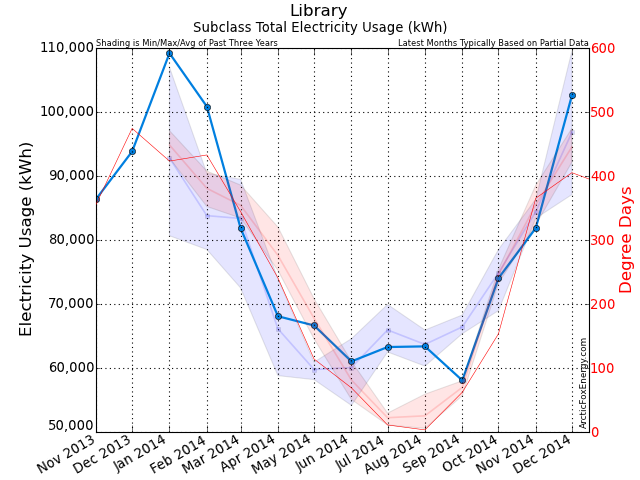
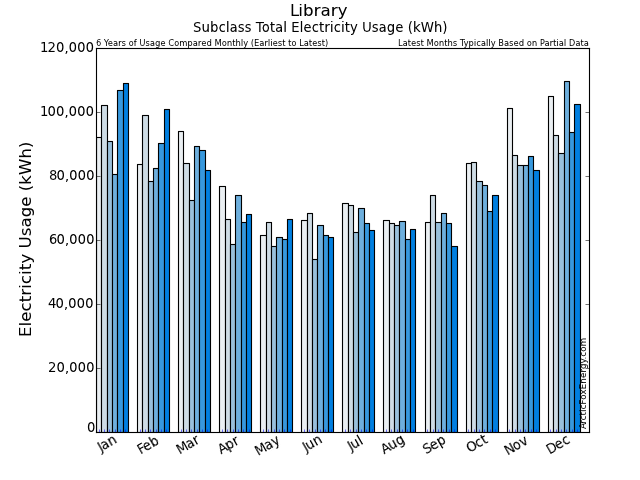
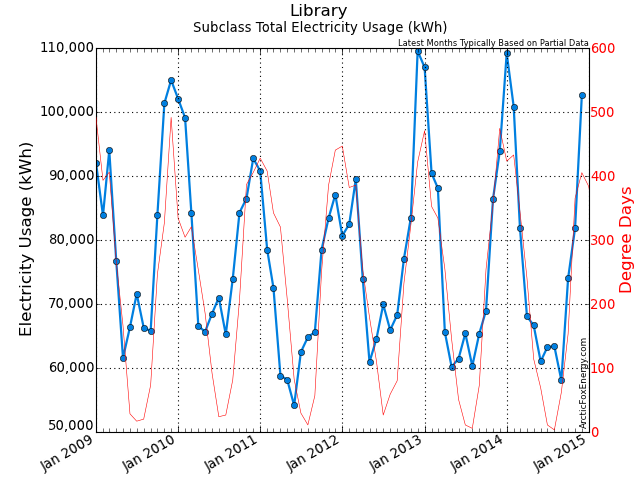
Monthly Electricity Data
| Date | Adj Elec Usage (kWh) | Read Usage (kWh) | Elec Cost ($) | Demand Cost ($) | PF Cost ($) | Total Elec Cost ($) | GHG (tCO2e) |
|---|---|---|---|---|---|---|---|
| Jan 2013 | 106,972.95 | 132,549.27 | 6,088.00 | 1,062.56 | 0.00 | 8,071.60 | 1.50 |
| Feb 2013 | 90,418.16 | 86,073.46 | 3,815.47 | 891.49 | 0.00 | 5,342.78 | 1.27 |
| Mar 2013 | 88,098.76 | 96,113.29 | 4,591.11 | 779.71 | 0.00 | 6,074.30 | 1.23 |
| Apr 2013 | 65,603.10 | 67,741.40 | 3,158.36 | 652.90 | 17.93 | 4,355.99 | 0.92 |
| May 2013 | 60,187.33 | 63,405.17 | 3,674.26 | 533.89 | 93.16 | 4,858.61 | 0.84 |
| Jun 2013 | 61,463.28 | 53,670.81 | 2,444.70 | 616.25 | 124.71 | 3,628.50 | 0.86 |
| Jul 2013 | 65,406.90 | 76,397.44 | 3,847.05 | 408.64 | 121.46 | 4,963.03 | 0.92 |
| Aug 2013 | 60,302.04 | 49,272.46 | 2,715.86 | 327.64 | 109.42 | 3,556.89 | 0.84 |
| Sep 2013 | 65,356.60 | 76,558.85 | 3,964.72 | 486.42 | 22.23 | 5,011.16 | 0.91 |
| Oct 2013 | 68,961.83 | 44,165.69 | 2,318.56 | 361.81 | 0.00 | 3,002.21 | 0.97 |
| Nov 2013 | 86,376.03 | 104,825.21 | 5,658.69 | 1,069.54 | 26.69 | 7,631.51 | 1.21 |
| Dec 2013 | 93,836.22 | 80,542.49 | 3,593.56 | 897.84 | 0.00 | 5,098.33 | 1.31 |
| Jan 2014 | 109,183.89 | 112,949.22 | 5,299.15 | 1,300.35 | 0.00 | 7,341.95 | 1.09 |
| Feb 2014 | 100,854.48 | 95,001.24 | 3,868.18 | 1,080.49 | 0.00 | 5,597.40 | 1.01 |
| Mar 2014 | 81,855.76 | 102,735.01 | 5,740.44 | 694.66 | 0.00 | 7,140.38 | 0.82 |
| Apr 2014 | 68,087.96 | 48,832.17 | 2,200.70 | 452.93 | 0.00 | 3,037.84 | 0.68 |
| May 2014 | 66,640.99 | 83,842.36 | 4,833.13 | 1,176.10 | 44.72 | 6,809.10 | 0.67 |
| Jun 2014 | 61,030.42 | 58,046.90 | 3,181.74 | 710.22 | 42.52 | 4,343.22 | 0.61 |
| Jul 2014 | 63,274.86 | 65,879.10 | 3,746.67 | 610.05 | 196.32 | 5,130.25 | 0.63 |
| Aug 2014 | 63,378.99 | 46,068.76 | 2,322.27 | 350.75 | 0.00 | 2,963.61 | 0.63 |
| Sep 2014 | 58,067.46 | 76,751.79 | 4,742.70 | 1,102.77 | 237.34 | 6,821.76 | 0.58 |
| Oct 2014 | 74,016.90 | 64,808.16 | 3,552.06 | 773.37 | -0.79 | 4,789.52 | 0.74 |
| Nov 2014 | 81,871.12 | 57,017.92 | 3,478.22 | 0.00 | 0.00 | 3,922.38 | 0.82 |
| Dec 2014 | 102,591.97 | 123,047.87 | 7,471.62 | 0.00 | 0.00 | 8,432.56 | 1.03 |
Download Monthly Electricity Data as a CSV file for import into Excel.
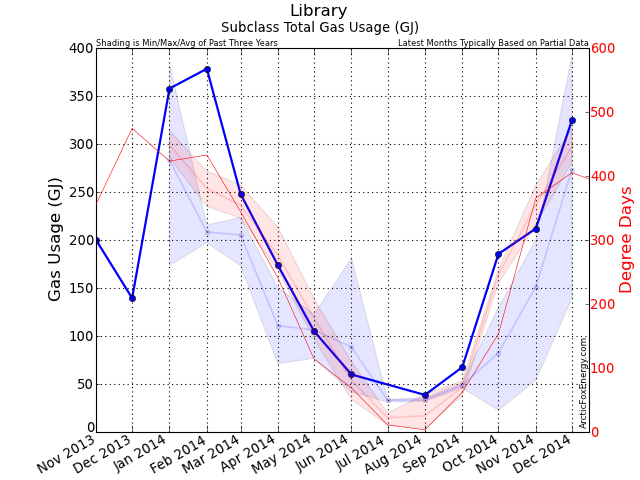
Monthly Gas Data
| Date | Adj Gas Usage (GJ) | Read Usage (GJ) | Gas Cost ($) | Basic / Mgmt Cost ($) | Delivery Cost ($) | Midstream Cost ($) | Total Gas Cost ($) | GHG (tCO2e) |
|---|---|---|---|---|---|---|---|---|
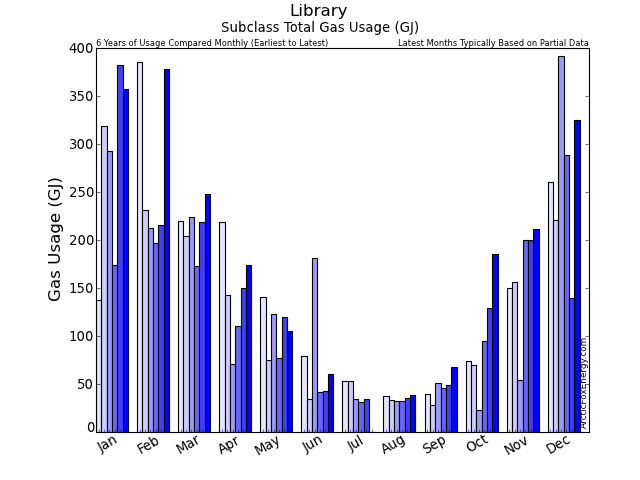
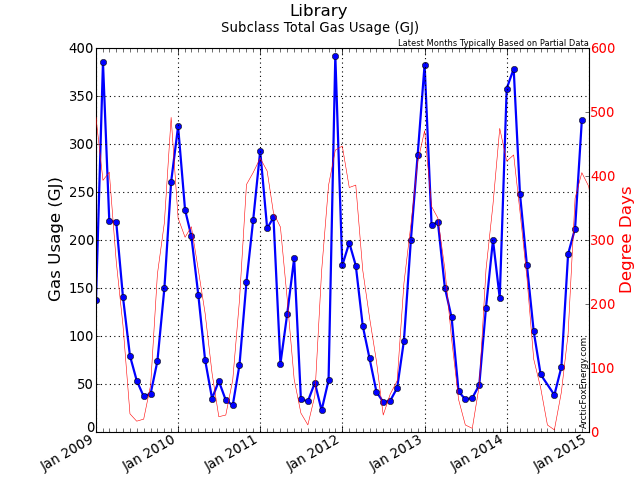
| Jan 2013 | 382.81 | 382.81 | 4,372.67 | 73.76 | 0.00 | 0.00 | 4,446.43 | 19.04 |
| Feb 2013 | 215.53 | 215.53 | 2,718.72 | 81.70 | 0.00 | 0.00 | 2,800.42 | 10.72 |
| Mar 2013 | 218.72 | 218.72 | 2,565.15 | 79.68 | 0.00 | 0.00 | 2,644.83 | 10.88 |
| Apr 2013 | 150.42 | 150.42 | 1,885.57 | 78.39 | 0.00 | 0.00 | 1,963.96 | 7.48 |
| May 2013 | 119.40 | 119.40 | 1,410.41 | 83.63 | 0.00 | 0.00 | 1,494.04 | 5.94 |
| Jun 2013 | 42.26 | 42.26 | 452.00 | 82.91 | 0.00 | 0.00 | 534.92 | 2.10 |
| Jul 2013 | 33.97 | 33.97 | 483.15 | 82.77 | 0.00 | 0.00 | 565.91 | 1.69 |
| Aug 2013 | 35.46 | 35.46 | 401.00 | 76.47 | 0.00 | 0.00 | 477.48 | 1.76 |
| Sep 2013 | 48.94 | 48.94 | 604.12 | 81.48 | 0.00 | 0.00 | 685.60 | 2.43 |
| Oct 2013 | 129.67 | 129.67 | 1,727.08 | 75.90 | 0.00 | 0.00 | 1,802.98 | 6.45 |
| Nov 2013 | 200.11 | 200.11 | 2,447.87 | 81.45 | 0.00 | 0.00 | 2,529.32 | 9.96 |
| Dec 2013 | 139.41 | 139.41 | 1,679.05 | 54.06 | 0.00 | 0.00 | 1,733.11 | 6.94 |
| Jan 2014 | 357.79 | 344.27 | 4,130.46 | 50.22 | 0.00 | 0.00 | 4,180.69 | 17.80 |
| Feb 2014 | 378.38 | 391.89 | 4,967.07 | 124.92 | 0.00 | 0.00 | 5,091.99 | 18.82 |
| Mar 2014 | 247.94 | 247.94 | 3,085.18 | 79.39 | 0.00 | 0.00 | 3,164.56 | 12.33 |
| Apr 2014 | 173.57 | 173.57 | 2,318.86 | 75.81 | 0.00 | 0.00 | 2,394.68 | 8.64 |
| May 2014 | 104.93 | 104.93 | 1,305.44 | 79.78 | 0.00 | 0.00 | 1,385.22 | 5.22 |
| Jun 2014 | 59.91 | 59.91 | 718.24 | 79.68 | 0.00 | 0.00 | 797.92 | 2.98 |
| Jul 2014 | 0.00 | 0.00 | 0.00 | 0.00 | 0.00 | 0.00 | 0.00 | 0.00 |
| Aug 2014 | 38.61 | 38.61 | 571.60 | 78.91 | 0.00 | 0.00 | 650.52 | 1.92 |
| Sep 2014 | 67.53 | 67.53 | 835.11 | 75.52 | 0.00 | 0.00 | 910.63 | 3.36 |
| Oct 2014 | 185.46 | 135.57 | 1,659.35 | 78.55 | 0.00 | 0.00 | 1,737.90 | 9.23 |
| Nov 2014 | 211.93 | 205.91 | 1,600.06 | 68.86 | 506.83 | 296.89 | 2,884.56 | 10.54 |
| Dec 2014 | 324.76 | 213.68 | 2,334.19 | 68.74 | 772.62 | 413.59 | 4,212.16 | 16.16 |
Download Monthly Gas Data as a CSV file for import into Excel.
Monthly Total Data
| Date | Adj Gas Usage (GJ) | Total Gas Cost ($) | Adj Elec Usage (kWh) | Total Elec Cost ($) | Total Usage (ekWh) | Total Cost ($) | GHG (tCO2e) |
|---|---|---|---|---|---|---|---|
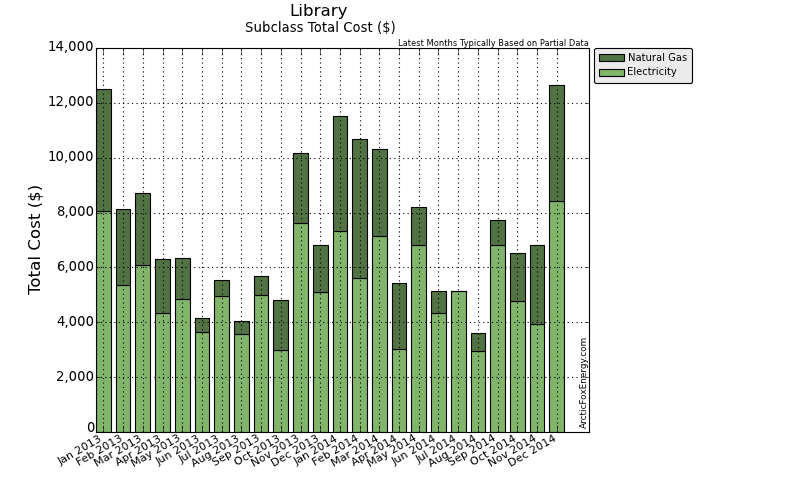
| Jan 2013 | 382.81 | 4,446.43 | 106,972.95 | 8,071.60 | 213,309.33 | 12,518.03 | 20.54 |
| Feb 2013 | 215.53 | 2,800.42 | 90,418.16 | 5,342.78 | 150,287.45 | 8,143.20 | 11.99 |
| Mar 2013 | 218.72 | 2,644.83 | 88,098.76 | 6,074.30 | 148,853.87 | 8,719.13 | 12.11 |
| Apr 2013 | 150.42 | 1,963.96 | 65,603.10 | 4,355.99 | 107,386.86 | 6,319.95 | 8.40 |
| May 2013 | 119.40 | 1,494.04 | 60,187.33 | 4,858.61 | 93,355.11 | 6,352.65 | 6.78 |
| Jun 2013 | 42.26 | 534.92 | 61,463.28 | 3,628.50 | 73,203.47 | 4,163.42 | 2.96 |
| Jul 2013 | 33.97 | 565.91 | 65,406.90 | 4,963.03 | 74,842.23 | 5,528.94 | 2.61 |
| Aug 2013 | 35.46 | 477.48 | 60,302.04 | 3,556.89 | 70,150.72 | 4,034.36 | 2.61 |
| Sep 2013 | 48.94 | 685.60 | 65,356.60 | 5,011.16 | 78,952.04 | 5,696.76 | 3.35 |
| Oct 2013 | 129.67 | 1,802.98 | 68,961.83 | 3,002.21 | 104,982.18 | 4,805.19 | 7.42 |
| Nov 2013 | 200.11 | 2,529.32 | 86,376.03 | 7,631.51 | 141,960.89 | 10,160.83 | 11.16 |
| Dec 2013 | 139.41 | 1,733.11 | 93,836.22 | 5,098.33 | 132,562.31 | 6,831.44 | 8.25 |
| Jan 2014 | 357.79 | 4,180.69 | 109,183.89 | 7,341.95 | 208,568.99 | 11,522.63 | 18.89 |
| Feb 2014 | 378.38 | 5,091.99 | 100,854.48 | 5,597.40 | 205,958.74 | 10,689.40 | 19.83 |
| Mar 2014 | 247.94 | 3,164.56 | 81,855.76 | 7,140.38 | 150,726.67 | 10,304.94 | 13.15 |
| Apr 2014 | 173.57 | 2,394.68 | 68,087.96 | 3,037.84 | 116,301.78 | 5,432.51 | 9.32 |
| May 2014 | 104.93 | 1,385.22 | 66,640.99 | 6,809.10 | 95,789.35 | 8,194.31 | 5.89 |
| Jun 2014 | 59.91 | 797.92 | 61,030.42 | 4,343.22 | 77,671.16 | 5,141.14 | 3.59 |
| Jul 2014 | 0.00 | 0.00 | 63,274.86 | 5,130.25 | 63,274.86 | 5,130.25 | 0.63 |
| Aug 2014 | 38.61 | 650.52 | 63,378.99 | 2,963.61 | 74,104.23 | 3,614.12 | 2.55 |
| Sep 2014 | 67.53 | 910.63 | 58,067.46 | 6,821.76 | 76,826.53 | 7,732.39 | 3.94 |
| Oct 2014 | 185.46 | 1,737.90 | 74,016.90 | 4,789.52 | 125,534.42 | 6,527.42 | 9.97 |
| Nov 2014 | 211.93 | 2,884.56 | 81,871.12 | 3,922.38 | 140,740.12 | 6,806.94 | 11.36 |
| Dec 2014 | 324.76 | 4,212.16 | 102,591.97 | 8,432.56 | 192,803.12 | 12,644.73 | 17.18 |
Download Monthly Total Data as a CSV file for import into Excel.
Yearly Data
| Date | Gas Usage (GJ) | Total Gas Cost ($) | Elec Usage (kWh) | Total Elec Cost ($) | Total Usage (ekWh) | Total Cost ($) | GHG (tCO2e) |
|---|---|---|---|---|---|---|---|
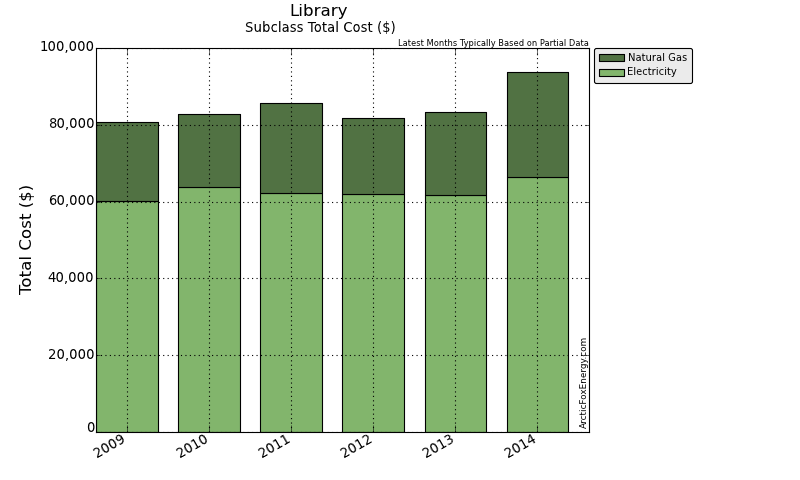
| 2009 | 1,795.82 | 20,594.67 | 968,525.33 | 60,235.61 | 1,467,364.79 | 80,830.28 | 114.52 |
| 2010 | 1,567.89 | 19,036.02 | 959,810.97 | 63,742.35 | 1,395,335.65 | 82,778.36 | 102.96 |
| 2011 | 1,689.29 | 23,277.37 | 854,914.16 | 62,312.65 | 1,324,161.03 | 85,590.02 | 105.41 |
| 2012 | 1,466.24 | 19,878.83 | 926,340.24 | 61,972.64 | 1,333,629.93 | 81,851.47 | 96.10 |
| 2013 | 1,716.71 | 21,679.00 | 912,983.19 | 61,594.90 | 1,389,846.46 | 83,273.90 | 98.19 |
| 2014 | 2,150.80 | 27,410.84 | 930,854.81 | 66,329.96 | 1,528,299.97 | 93,740.79 | 116.31 |
Download Yearly Data as a CSV file for import into Excel.
Metrics
Hours of Usage per Year: 8760 hours
| Date | Usage per Hour (ekWh/h) |
|---|---|
| 2009 | 167.51 |
| 2010 | 159.28 |
| 2011 | 151.16 |
| 2012 | 152.24 |
| 2013 | 158.66 |
| 2014 | 174.46 |
Download Metric Data as a CSV file for import into Excel.
Notes
Please view the Report Notes page for important details about this report.
If any data appears unusual, please contact info@ArcticFoxEnergy.com for a manual verification. If any anomalies are detected, they will be immediately corrected.
