4783 First Street
Details
Address: 4783 First Street
Account #: 1985283926
Account Type: BC Hydro
Last Entry: 2015-01-17
Monthly Data
| Date | Adj Elec Usage (kWh) | Read Usage (kWh) | Demand (kW) | PF (%) | Elec Cost ($) | Demand Cost ($) | PF Cost ($) | Total Elec Cost ($) | GHG (tCO2e) |
|---|---|---|---|---|---|---|---|---|---|
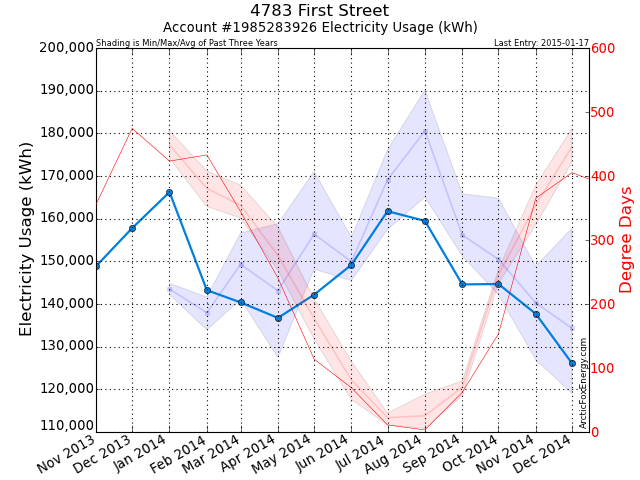
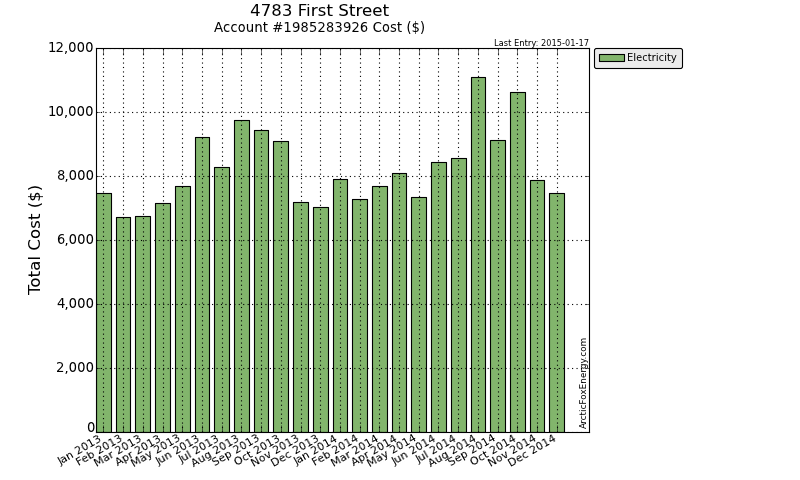
| Jan 2013 | 144,832.40 | 115,799.86 | 258.00 | 95.48 | 5,312.01 | 1,366.46 | 0.00 | 7,462.94 | 2.03 |
| Feb 2013 | 138,269.66 | 150,426.09 | 238.69 | 85.49 | 4,706.29 | 1,225.79 | 0.00 | 6,722.44 | 1.94 |
| Mar 2013 | 150,170.04 | 149,429.30 | 258.56 | 92.20 | 4,606.92 | 1,317.86 | 0.00 | 6,745.50 | 2.10 |
| Apr 2013 | 158,827.07 | 150,637.87 | 312.41 | 85.57 | 4,884.78 | 1,420.55 | 0.00 | 7,154.30 | 2.22 |
| May 2013 | 171,056.38 | 161,941.87 | 387.17 | 90.84 | 5,043.59 | 1,761.51 | 0.00 | 7,696.44 | 2.39 |
| Jun 2013 | 155,653.61 | 180,889.76 | 361.97 | 102.39 | 6,022.17 | 2,100.40 | 0.00 | 9,213.29 | 2.18 |
| Jul 2013 | 176,163.95 | 143,966.24 | 336.45 | 100.49 | 5,542.78 | 1,781.90 | 0.00 | 8,293.22 | 2.47 |
| Aug 2013 | 190,150.73 | 202,501.40 | 420.78 | 88.37 | 6,510.31 | 2,039.78 | 0.00 | 9,748.41 | 2.66 |
| Sep 2013 | 151,258.46 | 177,822.95 | 392.34 | 96.29 | 6,321.23 | 2,047.52 | 0.00 | 9,434.92 | 2.12 |
| Oct 2013 | 144,395.09 | 142,407.01 | 312.20 | 99.71 | 6,403.47 | 1,632.98 | 0.00 | 9,104.14 | 2.02 |
| Nov 2013 | 148,850.43 | 149,371.18 | 293.11 | 101.10 | 5,032.43 | 1,252.07 | 0.00 | 7,179.73 | 2.08 |
| Dec 2013 | 157,783.37 | 133,555.30 | 274.69 | 106.33 | 4,929.41 | 1,339.81 | 0.00 | 7,040.00 | 2.21 |
| Jan 2014 | 166,227.22 | 160,226.52 | 299.13 | 108.60 | 5,437.86 | 1,584.66 | 0.00 | 7,898.94 | 1.66 |
| Feb 2014 | 143,235.65 | 174,996.23 | 266.74 | 92.57 | 5,160.04 | 1,293.66 | 0.00 | 7,281.30 | 1.43 |
| Mar 2014 | 140,378.72 | 132,397.04 | 271.83 | 85.62 | 5,273.42 | 1,599.24 | 0.00 | 7,697.03 | 1.40 |
| Apr 2014 | 136,739.80 | 148,662.81 | 289.60 | 105.40 | 5,860.05 | 1,465.48 | 0.00 | 8,095.73 | 1.37 |
| May 2014 | 142,178.52 | 128,923.78 | 329.09 | 108.39 | 4,922.07 | 1,560.51 | 0.00 | 7,336.09 | 1.42 |
| Jun 2014 | 149,186.35 | 141,825.77 | 353.84 | 101.73 | 5,520.18 | 1,912.87 | 0.00 | 8,452.13 | 1.49 |
| Jul 2014 | 161,757.17 | 151,905.30 | 362.00 | 95.01 | 5,843.11 | 1,780.77 | 0.00 | 8,572.41 | 1.62 |
| Aug 2014 | 159,468.61 | 166,620.66 | 388.43 | 101.30 | 7,393.63 | 2,602.38 | 0.00 | 11,088.41 | 1.59 |
| Sep 2014 | 144,590.95 | 153,135.58 | 391.93 | 86.98 | 6,080.77 | 2,114.31 | 0.00 | 9,121.47 | 1.45 |
| Oct 2014 | 144,689.33 | 153,608.46 | 363.24 | 82.92 | 7,684.22 | 1,896.71 | 0.00 | 10,628.00 | 1.45 |
| Nov 2014 | 137,692.26 | 140,333.13 | 318.50 | 88.92 | 6,869.79 | 0.00 | 0.00 | 7,869.31 | 1.38 |
| Dec 2014 | 126,118.68 | 126,627.92 | 338.95 | 106.00 | 6,544.87 | 0.00 | 0.00 | 7,466.44 | 1.26 |
Download Monthly Data as a CSV file for import into Excel.
Yearly Data
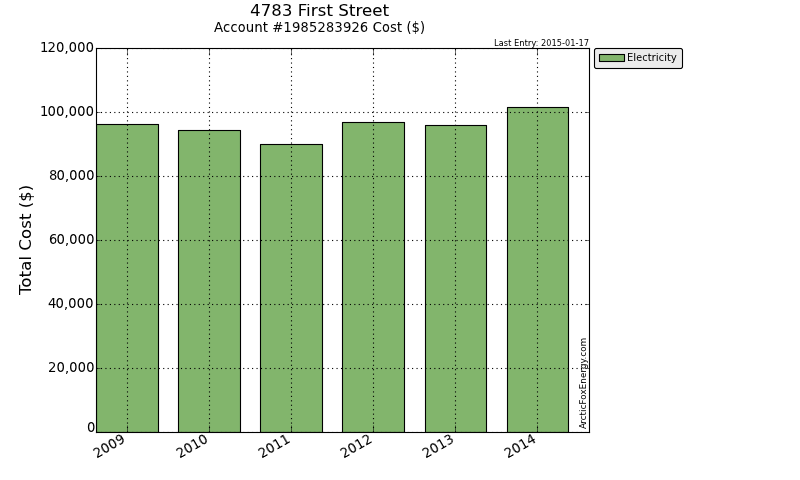
| Date | Elec Usage (kWh) | Total Elec Cost ($) | GHG (tCO2e) |
|---|---|---|---|
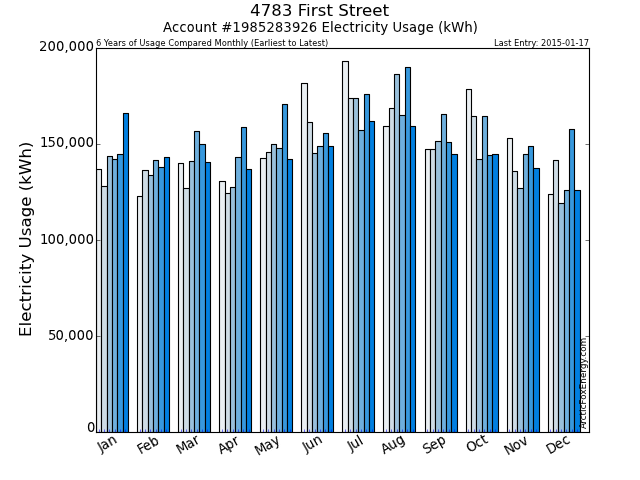
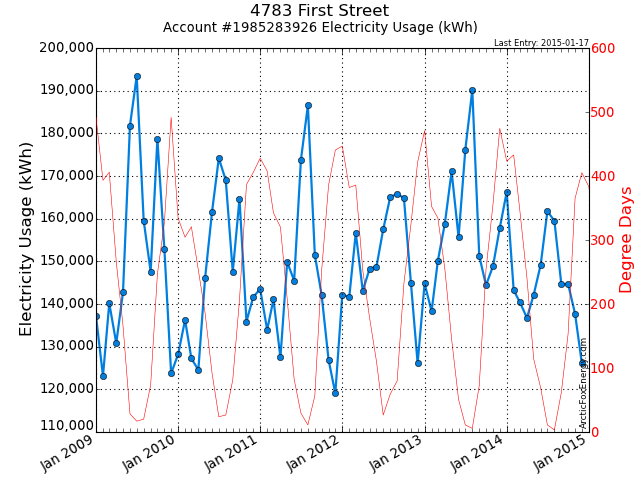
| 2009 | 1,811,630.96 | 96,132.68 | 47.10 |
| 2010 | 1,756,876.40 | 94,285.06 | 45.68 |
| 2011 | 1,741,218.48 | 90,023.18 | 43.53 |
| 2012 | 1,804,819.71 | 96,878.16 | 45.12 |
| 2013 | 1,887,411.20 | 95,795.31 | 26.42 |
| 2014 | 1,752,263.25 | 101,507.24 | 17.52 |
Download Yearly Data as a CSV file for import into Excel.
Notes
Please view the Report Notes page for important details about this report.
If any data appears unusual, please contact info@ArcticFoxEnergy.com for a manual verification. If any anomalies are detected, they will be immediately corrected.
