Sample Report Grand Total
Details
This page presents the totals for all tracked accounts for Sample Report.
Total Electricity and Gas Usage Data
| Date | 2012 | 2013 | 2014 |
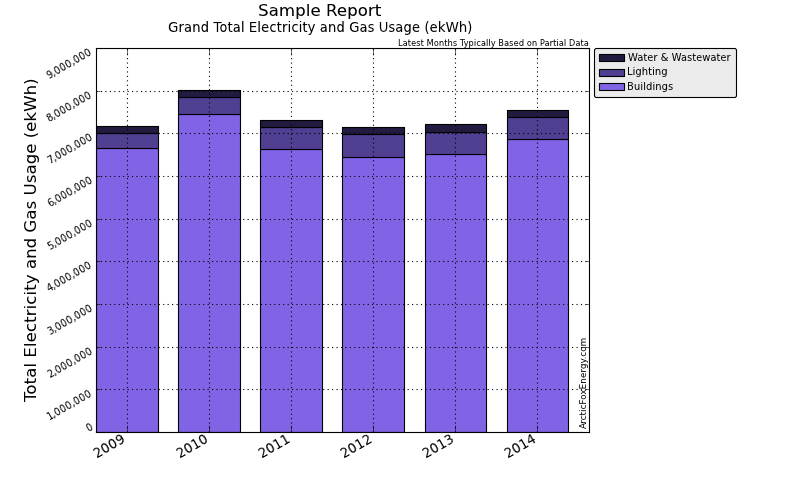
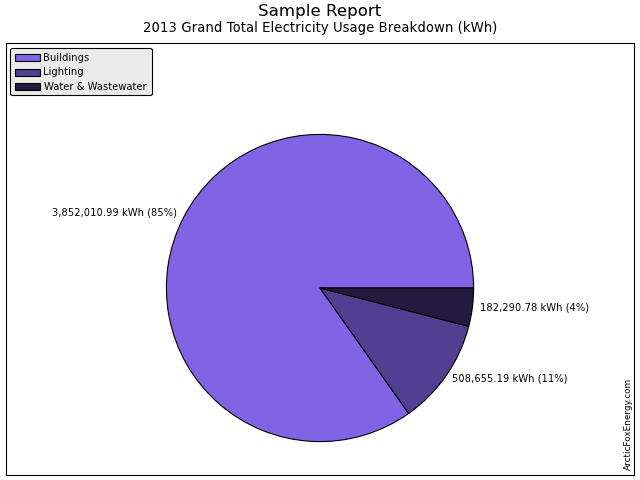
| Buildings Usage (ekWh) | 6,450,476.11 | 6,519,559.45 | 6,870,174.58 |
| Lighting Usage (ekWh) | 524,430.05 | 508,655.19 | 502,856.76 |
| Water & Wastewater Usage (ekWh) | 179,159.27 | 182,290.78 | 175,569.43 |
| Total Usage (ekWh) | 7,154,065.43 | 7,210,505.43 | 7,548,600.77 |
Download Total Electricity and Gas Usage Data as a CSV file for import into Excel.
Total Electricity and Gas Cost Data
| Date | 2012 | 2013 | 2014 |
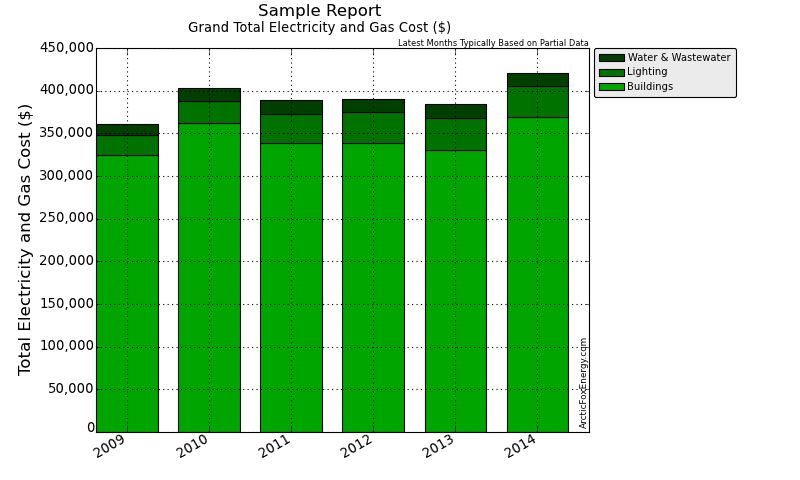
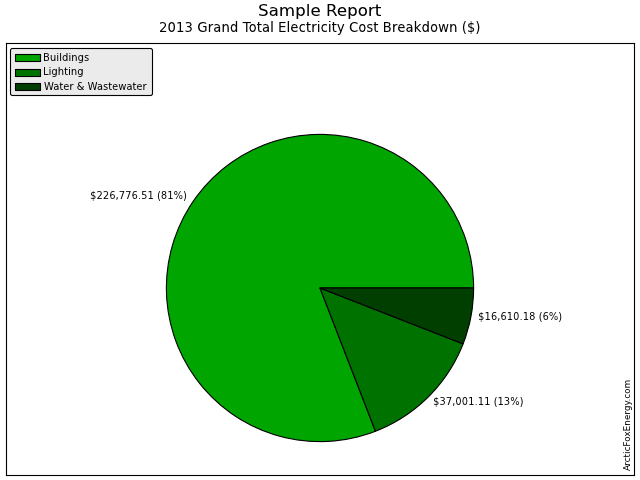
| Buildings Cost ($) | 338,459.94 | 331,041.64 | 369,454.95 |
| Lighting Cost ($) | 36,264.54 | 37,001.11 | 36,152.28 |
| Water & Wastewater Cost ($) | 15,666.76 | 16,610.18 | 15,483.83 |
| Total Cost ($) | 390,391.24 | 384,652.92 | 421,091.06 |
Download Total Electricity and Gas Cost Data as a CSV file for import into Excel.
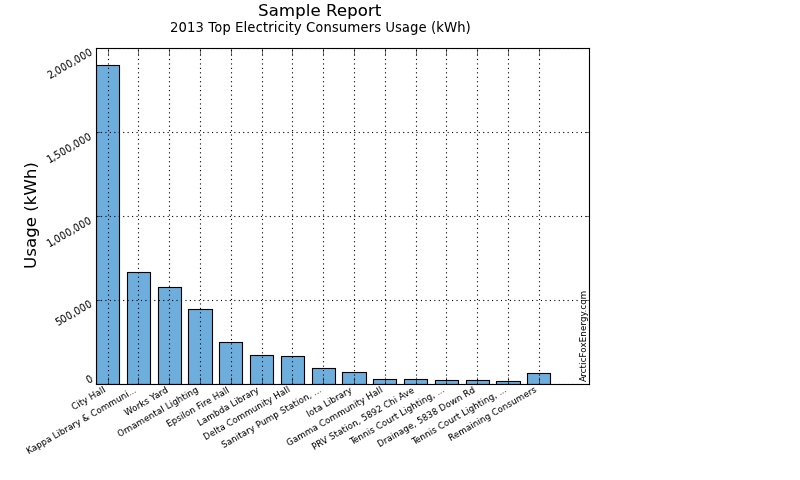
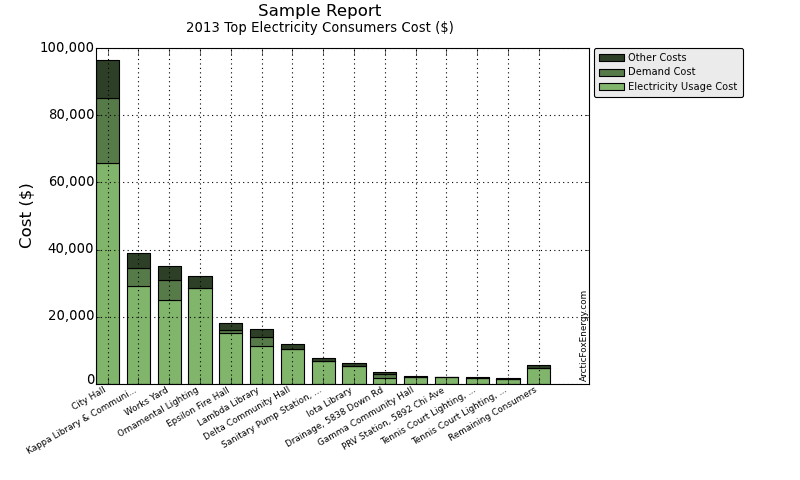
2013 Top Electricity Consumers Data
| Consumer Name | Elec Usage (kWh) | Elec Cost ($) | Demand Cost ($) | Total Elec Cost ($) |
|---|---|---|---|---|
| City Hall | 1,896,570.39 | 65,912.78 | 19,286.64 | 96,432.63 |
| Kappa Library & Communi... | 668,270.10 | 29,027.06 | 5,573.88 | 39,065.20 |
| Works Yard | 579,481.22 | 25,116.51 | 5,847.30 | 35,052.64 |
| Ornamental Lighting | 447,564.98 | 28,568.99 | 0.00 | 32,199.48 |
| Epsilon Fire Hall | 249,749.41 | 15,035.80 | 945.29 | 18,033.43 |
| Lambda Library | 174,675.34 | 11,364.46 | 2,514.80 | 16,301.16 |
| Delta Community Hall | 166,382.43 | 10,477.54 | 14.70 | 11,815.93 |
| Sanitary Pump Station, ... | 96,336.98 | 6,778.46 | 14.04 | 7,680.95 |
| Iota Library | 70,037.75 | 5,478.82 | 0.00 | 6,228.54 |
| Drainage, 5838 Down Rd | 22,833.28 | 1,706.78 | 1,223.50 | 3,640.01 |
| Gamma Community Hall | 31,706.64 | 2,187.33 | 0.00 | 2,474.38 |
| PRV Station, 5892 Chi Ave | 26,951.66 | 1,957.10 | 0.00 | 2,210.09 |
| Tennis Court Lighting, ... | 25,825.38 | 1,831.58 | 0.00 | 2,077.07 |
| Tennis Court Lighting, ... | 19,765.61 | 1,456.24 | 0.00 | 1,639.53 |
| Remaining Consumers | 66,805.79 | 4,902.51 | 0.00 | 5,536.76 |
| Total | 4,542,956.96 | 211,801.97 | 35,420.15 | 280,387.80 |
Download Top Electricity Consumers Data as a CSV file for import into Excel.
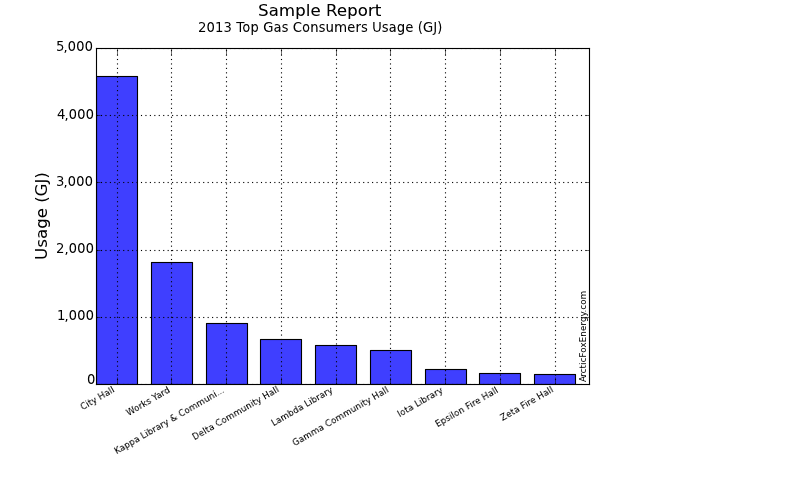
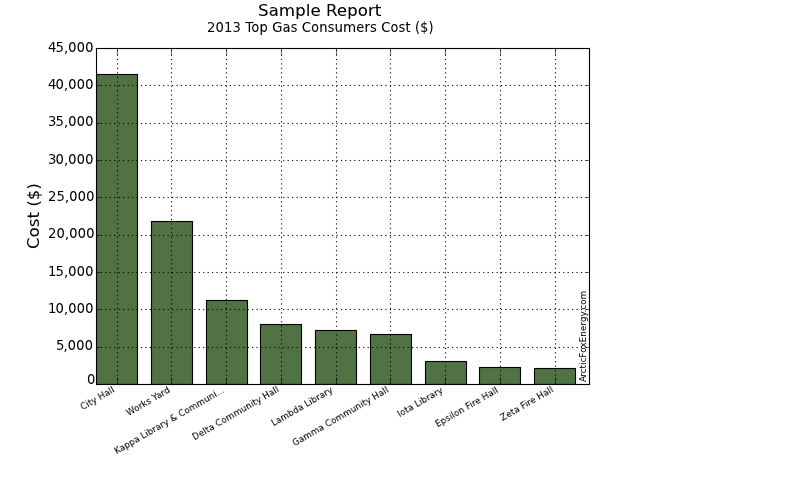
2013 Top Gas Consumers Data
| Consumer Name | Gas Usage (GJ) | Total Gas Cost ($) |
|---|---|---|
| City Hall | 4,587.09 | 41,549.16 |
| Works Yard | 1,812.26 | 21,872.70 |
| Kappa Library & Communi... | 904.33 | 11,273.13 |
| Delta Community Hall | 665.47 | 8,004.07 |
| Lambda Library | 584.66 | 7,289.75 |
| Gamma Community Hall | 506.35 | 6,748.45 |
| Iota Library | 227.72 | 3,116.11 |
| Epsilon Fire Hall | 163.43 | 2,228.20 |
| Zeta Fire Hall | 151.87 | 2,183.55 |
| Total | 9,603.17 | 104,265.12 |
Download Top Gas Consumers Data as a CSV file for import into Excel.
Monthly Electricity Data
| Date | Adj Elec Usage (kWh) | Read Usage (kWh) | Elec Cost ($) | Demand Cost ($) | PF Cost ($) | Total Elec Cost ($) | GHG (tCO2e) |
|---|---|---|---|---|---|---|---|
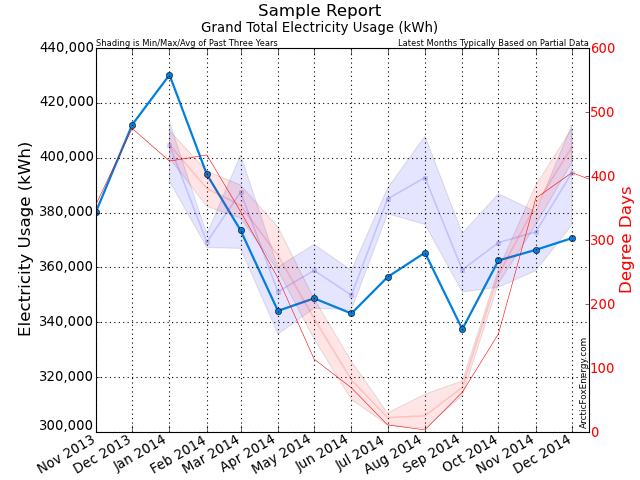
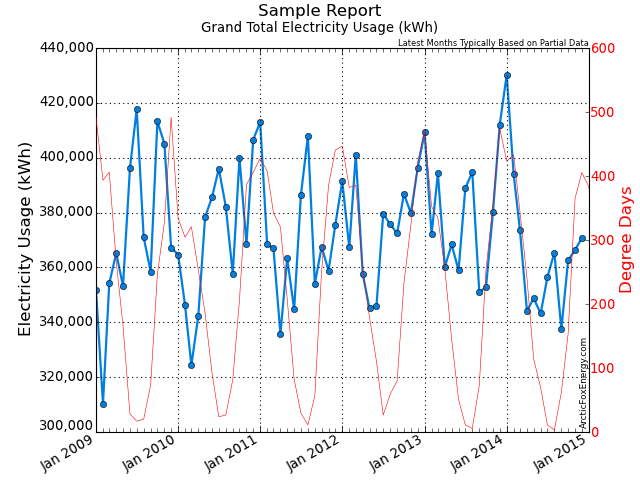
| Jan 2013 | 409,205.53 | 461,143.54 | 24,412.79 | 2,954.53 | 0.00 | 30,860.75 | 5.73 |
| Feb 2013 | 372,079.05 | 334,061.48 | 14,174.07 | 2,542.71 | 9.68 | 18,954.29 | 5.21 |
| Mar 2013 | 394,332.59 | 398,558.46 | 18,143.65 | 2,772.99 | 0.00 | 23,668.50 | 5.52 |
| Apr 2013 | 360,199.10 | 354,803.89 | 16,370.36 | 2,540.94 | 40.39 | 21,377.23 | 5.04 |
| May 2013 | 368,360.73 | 368,173.25 | 17,691.38 | 2,892.99 | 126.14 | 23,391.34 | 5.16 |
| Jun 2013 | 358,962.47 | 381,749.95 | 16,772.12 | 3,616.37 | 158.19 | 23,258.51 | 5.03 |
| Jul 2013 | 388,893.67 | 361,548.75 | 17,701.39 | 2,878.99 | 160.80 | 23,434.06 | 5.44 |
| Aug 2013 | 394,762.30 | 442,358.43 | 19,687.51 | 3,358.19 | 147.69 | 26,296.08 | 5.53 |
| Sep 2013 | 351,057.69 | 342,976.20 | 14,390.08 | 3,108.61 | 64.68 | 19,805.20 | 4.91 |
| Oct 2013 | 352,782.24 | 333,625.34 | 17,900.30 | 2,794.18 | 35.54 | 23,384.02 | 4.94 |
| Nov 2013 | 380,317.18 | 392,185.15 | 18,656.79 | 3,147.83 | 55.32 | 24,799.50 | 5.32 |
| Dec 2013 | 412,004.41 | 350,980.71 | 15,901.51 | 2,811.81 | 0.00 | 21,158.33 | 5.77 |
| Jan 2014 | 430,204.26 | 443,702.77 | 20,375.28 | 3,373.88 | 4.83 | 26,595.65 | 4.30 |
| Feb 2014 | 393,895.15 | 425,247.17 | 18,240.46 | 2,811.28 | 5.04 | 23,634.23 | 3.94 |
| Mar 2014 | 373,539.12 | 417,758.30 | 21,146.88 | 2,796.99 | 19.38 | 26,778.21 | 3.74 |
| Apr 2014 | 344,165.00 | 318,627.74 | 14,926.46 | 2,367.10 | 18.74 | 19,366.62 | 3.44 |
| May 2014 | 348,728.84 | 343,846.08 | 18,204.89 | 3,107.78 | 69.59 | 24,068.10 | 3.49 |
| Jun 2014 | 343,210.13 | 337,115.52 | 16,988.44 | 3,444.15 | 81.35 | 23,048.93 | 3.43 |
| Jul 2014 | 356,503.44 | 348,903.86 | 18,215.07 | 3,048.25 | 240.42 | 24,149.83 | 3.57 |
| Aug 2014 | 365,384.52 | 350,931.98 | 18,169.17 | 3,465.11 | 36.60 | 24,157.02 | 3.65 |
| Sep 2014 | 337,472.99 | 367,049.93 | 18,920.79 | 3,919.93 | 279.59 | 25,790.20 | 3.37 |
| Oct 2014 | 362,532.14 | 358,950.99 | 19,480.93 | 3,327.91 | 25.29 | 25,309.91 | 3.63 |
| Nov 2014 | 366,406.78 | 332,755.15 | 18,378.92 | 0.00 | 31.01 | 20,920.96 | 3.66 |
| Dec 2014 | 370,669.68 | 404,388.43 | 24,764.86 | 0.00 | 0.00 | 28,090.58 | 3.71 |
Download Monthly Electricity Data as a CSV file for import into Excel.
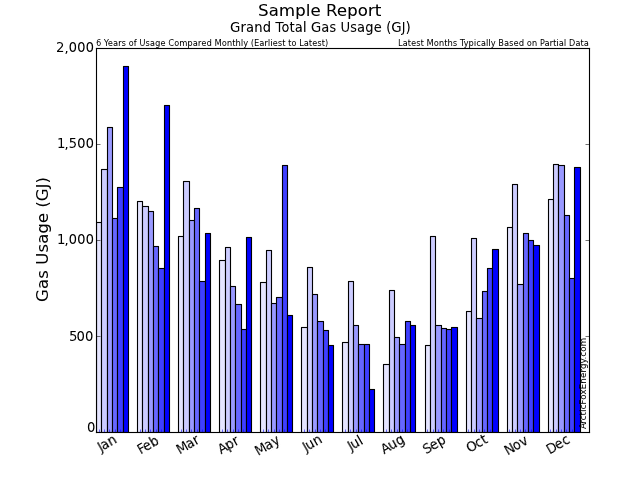
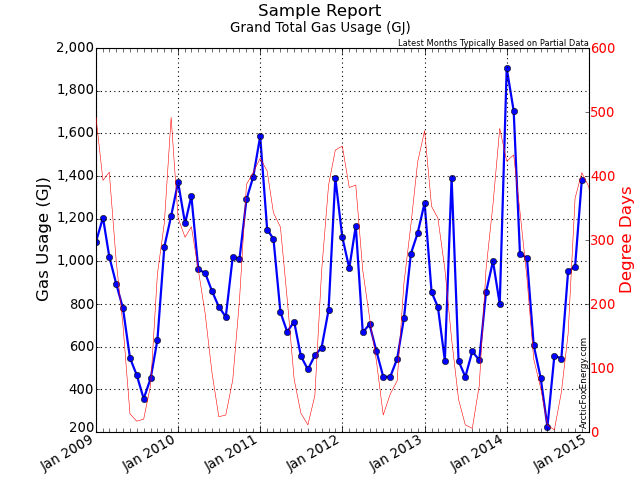
Monthly Gas Data
| Date | Adj Gas Usage (GJ) | Read Usage (GJ) | Gas Cost ($) | Basic / Mgmt Cost ($) | Delivery Cost ($) | Midstream Cost ($) | Total Gas Cost ($) | GHG (tCO2e) |
|---|---|---|---|---|---|---|---|---|
| Jan 2013 | 1,274.06 | 1,274.06 | 12,381.38 | 233.36 | 0.00 | 0.00 | 13,221.77 | 63.38 |
| Feb 2013 | 855.56 | 855.56 | 9,480.12 | 231.18 | 0.00 | 0.00 | 10,202.15 | 42.56 |
| Mar 2013 | 786.41 | 786.41 | 8,501.14 | 224.72 | 0.00 | 0.00 | 9,176.74 | 39.12 |
| Apr 2013 | 534.39 | 534.39 | 5,076.89 | 183.74 | 0.00 | 0.00 | 5,600.22 | 26.59 |
| May 2013 | 1,391.45 | 1,391.45 | 13,525.07 | 712.56 | 0.00 | 0.00 | 14,569.69 | 69.22 |
| Jun 2013 | 532.98 | 532.98 | 5,401.31 | 347.20 | 0.00 | 0.00 | 6,070.62 | 26.52 |
| Jul 2013 | 458.60 | 458.60 | 4,827.10 | 360.15 | 0.00 | 0.00 | 5,466.95 | 22.82 |
| Aug 2013 | 577.68 | 577.68 | 5,076.52 | 362.49 | 0.00 | 0.00 | 5,798.11 | 28.74 |
| Sep 2013 | 536.73 | 536.73 | 4,372.72 | 343.09 | 0.00 | 0.00 | 5,085.35 | 26.70 |
| Oct 2013 | 854.56 | 854.56 | 8,977.24 | 396.65 | 0.00 | 0.00 | 9,758.74 | 42.51 |
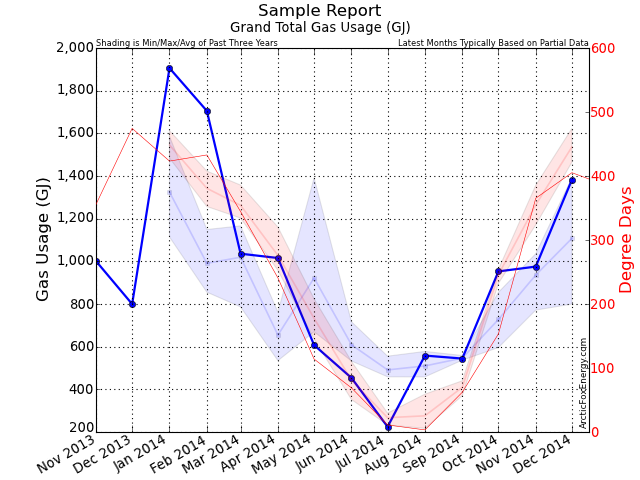
| Nov 2013 | 1,001.11 | 1,001.11 | 10,198.82 | 363.27 | 0.00 | 0.00 | 10,970.16 | 49.81 |
| Dec 2013 | 799.64 | 799.64 | 7,647.42 | 159.21 | 0.00 | 0.00 | 8,344.61 | 39.78 |
| Jan 2014 | 1,905.67 | 1,844.77 | 19,360.61 | 455.56 | 0.00 | 0.00 | 20,297.44 | 94.81 |
| Feb 2014 | 1,705.19 | 1,766.09 | 19,428.53 | 480.55 | 0.00 | 0.00 | 20,296.41 | 84.83 |
| Mar 2014 | 1,035.78 | 1,035.78 | 10,077.20 | 353.64 | 0.00 | 0.00 | 10,848.90 | 51.53 |
| Apr 2014 | 1,015.56 | 1,015.56 | 11,375.88 | 372.19 | 0.00 | 0.00 | 12,097.85 | 50.52 |
| May 2014 | 607.42 | 607.42 | 5,649.45 | 324.98 | 0.00 | 0.00 | 6,246.48 | 30.22 |
| Jun 2014 | 453.78 | 453.78 | 4,575.42 | 344.95 | 0.00 | 0.00 | 5,206.89 | 22.58 |
| Jul 2014 | 224.43 | 224.43 | 1,732.23 | 22.23 | 0.00 | 0.00 | 2,099.23 | 11.17 |
| Aug 2014 | 558.18 | 558.18 | 5,807.69 | 521.76 | 0.00 | 0.00 | 6,712.92 | 27.77 |
| Sep 2014 | 544.29 | 544.29 | 4,995.17 | 362.13 | 0.00 | 0.00 | 5,782.54 | 27.08 |
| Oct 2014 | 952.79 | 744.56 | 7,272.30 | 379.31 | 0.00 | 0.00 | 8,175.57 | 47.40 |
| Nov 2014 | 975.36 | 644.89 | 6,916.93 | 175.65 | 675.77 | 392.36 | 9,483.80 | 48.52 |
| Dec 2014 | 1,382.75 | 1,642.57 | 14,015.78 | 479.30 | 2,636.97 | 1,516.70 | 21,932.78 | 68.79 |
Download Monthly Gas Data as a CSV file for import into Excel.
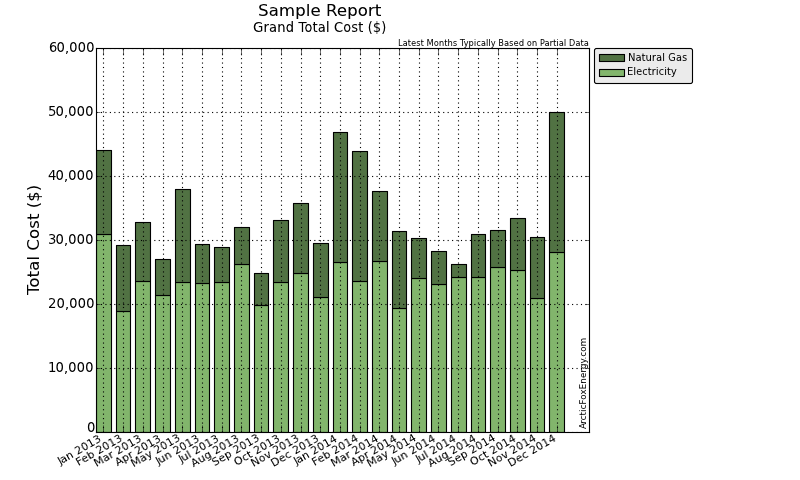
Monthly Total Data
| Date | Adj Gas Usage (GJ) | Total Gas Cost ($) | Adj Elec Usage (kWh) | Total Elec Cost ($) | Total Usage (ekWh) | Total Cost ($) | GHG (tCO2e) |
|---|---|---|---|---|---|---|---|
| Jan 2013 | 1,274.06 | 13,221.77 | 409,205.53 | 30,860.75 | 763,111.50 | 44,082.52 | 69.11 |
| Feb 2013 | 855.56 | 10,202.15 | 372,079.05 | 18,954.29 | 609,734.86 | 29,156.44 | 47.77 |
| Mar 2013 | 786.41 | 9,176.74 | 394,332.59 | 23,668.50 | 612,780.05 | 32,845.24 | 44.64 |
| Apr 2013 | 534.39 | 5,600.22 | 360,199.10 | 21,377.23 | 508,641.80 | 26,977.46 | 31.63 |
| May 2013 | 1,391.45 | 14,569.69 | 368,360.73 | 23,391.34 | 754,875.70 | 37,961.03 | 74.38 |
| Jun 2013 | 532.98 | 6,070.62 | 358,962.47 | 23,258.51 | 507,011.68 | 29,329.13 | 31.54 |
| Jul 2013 | 458.60 | 5,466.95 | 388,893.67 | 23,434.06 | 516,281.81 | 28,901.00 | 28.26 |
| Aug 2013 | 577.68 | 5,798.11 | 394,762.30 | 26,296.08 | 555,227.68 | 32,094.19 | 34.27 |
| Sep 2013 | 536.73 | 5,085.35 | 351,057.69 | 19,805.20 | 500,148.22 | 24,890.55 | 31.62 |
| Oct 2013 | 854.56 | 9,758.74 | 352,782.24 | 23,384.02 | 590,159.92 | 33,142.76 | 47.45 |
| Nov 2013 | 1,001.11 | 10,970.16 | 380,317.18 | 24,799.50 | 658,404.30 | 35,769.65 | 55.13 |
| Dec 2013 | 799.64 | 8,344.61 | 412,004.41 | 21,158.33 | 634,127.92 | 29,502.94 | 45.55 |
| Jan 2014 | 1,905.67 | 20,297.44 | 430,204.26 | 26,595.65 | 959,557.60 | 46,893.10 | 99.11 |
| Feb 2014 | 1,705.19 | 20,296.41 | 393,895.15 | 23,634.23 | 867,560.39 | 43,930.64 | 88.77 |
| Mar 2014 | 1,035.78 | 10,848.90 | 373,539.12 | 26,778.21 | 661,256.29 | 37,627.12 | 55.27 |
| Apr 2014 | 1,015.56 | 12,097.85 | 344,165.00 | 19,366.62 | 626,264.26 | 31,464.47 | 53.97 |
| May 2014 | 607.42 | 6,246.48 | 348,728.84 | 24,068.10 | 517,455.77 | 30,314.58 | 33.71 |
| Jun 2014 | 453.78 | 5,206.89 | 343,210.13 | 23,048.93 | 469,261.09 | 28,255.82 | 26.01 |
| Jul 2014 | 224.43 | 2,099.23 | 356,503.44 | 24,149.83 | 418,844.12 | 26,249.06 | 14.73 |
| Aug 2014 | 558.18 | 6,712.92 | 365,384.52 | 24,157.02 | 520,434.15 | 30,869.94 | 31.42 |
| Sep 2014 | 544.29 | 5,782.54 | 337,472.99 | 25,790.20 | 488,664.95 | 31,572.73 | 30.45 |
| Oct 2014 | 952.79 | 8,175.57 | 362,532.14 | 25,309.91 | 627,195.20 | 33,485.48 | 51.03 |
| Nov 2014 | 975.36 | 9,483.80 | 366,406.78 | 20,920.96 | 637,340.80 | 30,404.75 | 52.19 |
| Dec 2014 | 1,382.75 | 21,932.78 | 370,669.68 | 28,090.58 | 754,766.16 | 50,023.36 | 72.50 |
Download Monthly Total Data as a CSV file for import into Excel.
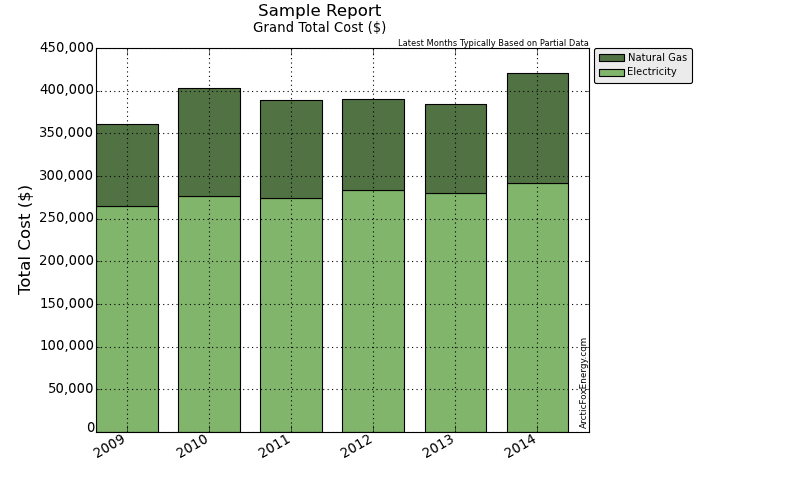
Yearly Data
| Date | Gas Usage (GJ) | Total Gas Cost ($) | Elec Usage (kWh) | Total Elec Cost ($) | Total Usage (ekWh) | Total Cost ($) | GHG (tCO2e) |
|---|---|---|---|---|---|---|---|
| 2009 | 9,727.57 | 95,498.46 | 4,463,737.23 | 265,376.19 | 7,165,840.16 | 360,874.65 | 600.00 |
| 2010 | 12,869.10 | 126,700.11 | 4,452,513.86 | 276,246.38 | 8,027,264.24 | 402,946.49 | 756.00 |
| 2011 | 10,354.88 | 115,500.50 | 4,442,212.75 | 273,642.42 | 7,318,568.63 | 389,142.93 | 626.21 |
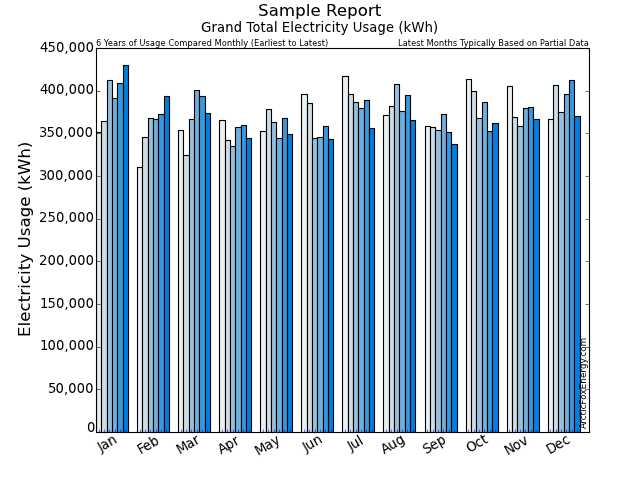
| 2012 | 9,558.78 | 107,171.64 | 4,498,850.07 | 283,219.61 | 7,154,065.43 | 390,391.24 | 588.02 |
| 2013 | 9,603.17 | 104,265.12 | 4,542,956.96 | 280,387.80 | 7,210,505.43 | 384,652.92 | 541.36 |
| 2014 | 11,361.20 | 129,180.82 | 4,392,712.06 | 291,910.24 | 7,548,600.77 | 421,091.06 | 609.15 |
Download Yearly Data as a CSV file for import into Excel.
Notes
Please view the Report Notes page for important details about this report.
If any data appears unusual, please contact info@ArcticFoxEnergy.com for a manual verification. If any anomalies are detected, they will be immediately corrected.
