Water & Wastewater Class Total
Details
This page presents the totals for all accounts in the Water & Wastewater class.
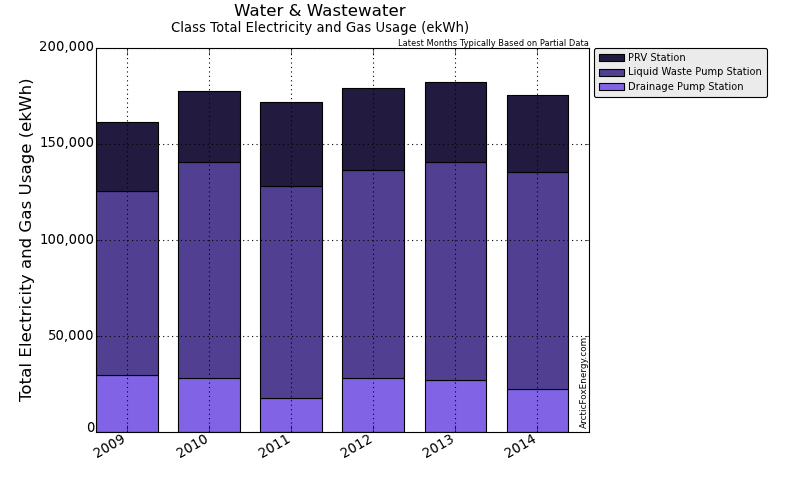
Total Electricity and Gas Usage Data
| Date | 2012 | 2013 | 2014 |
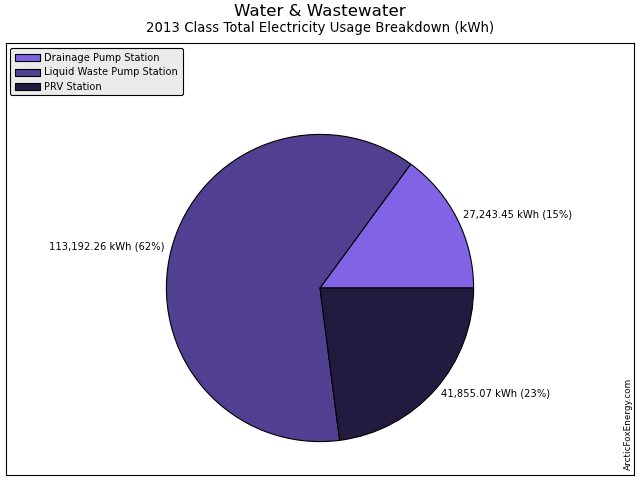
| Drainage Pump Station Usage (ekWh) | 28,140.66 | 27,243.45 | 22,403.49 |
| Liquid Waste Pump Station Usage (ekWh) | 108,290.36 | 113,192.26 | 113,020.50 |
| PRV Station Usage (ekWh) | 42,728.25 | 41,855.07 | 40,145.45 |
| Total Usage (ekWh) | 179,159.27 | 182,290.78 | 175,569.43 |
Download Total Electricity and Gas Usage Data as a CSV file for import into Excel.
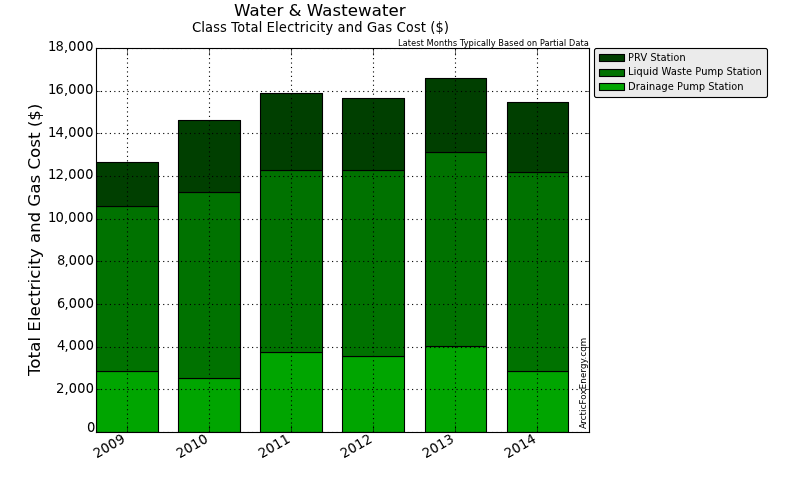
Total Electricity and Gas Cost Data
| Date | 2012 | 2013 | 2014 |
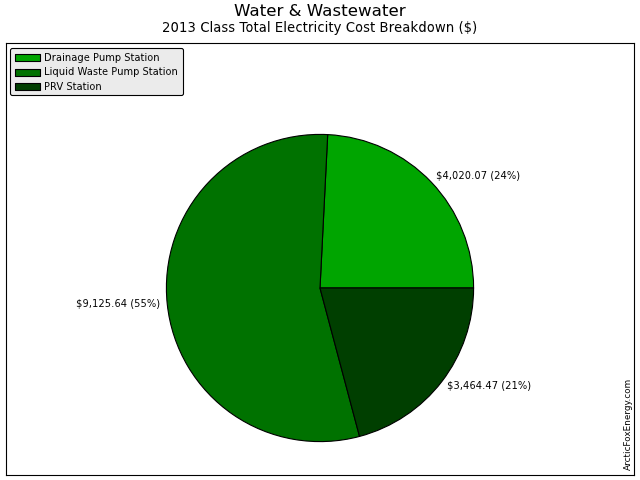
| Drainage Pump Station Cost ($) | 3,566.88 | 4,020.07 | 2,875.39 |
| Liquid Waste Pump Station Cost ($) | 8,717.38 | 9,125.64 | 9,319.06 |
| PRV Station Cost ($) | 3,382.51 | 3,464.47 | 3,289.38 |
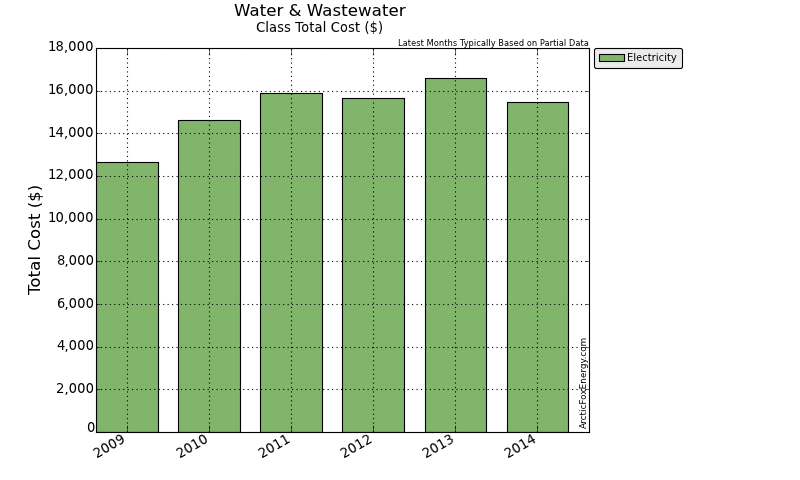
| Total Cost ($) | 15,666.76 | 16,610.18 | 15,483.83 |
Download Total Electricity and Gas Cost Data as a CSV file for import into Excel.
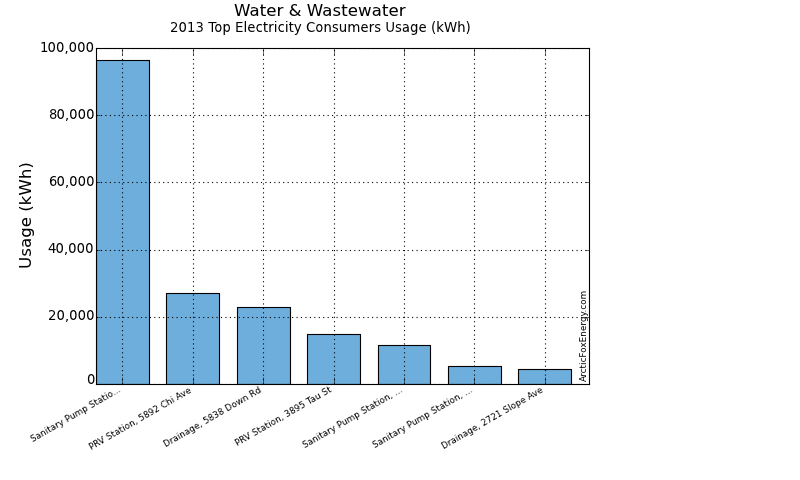
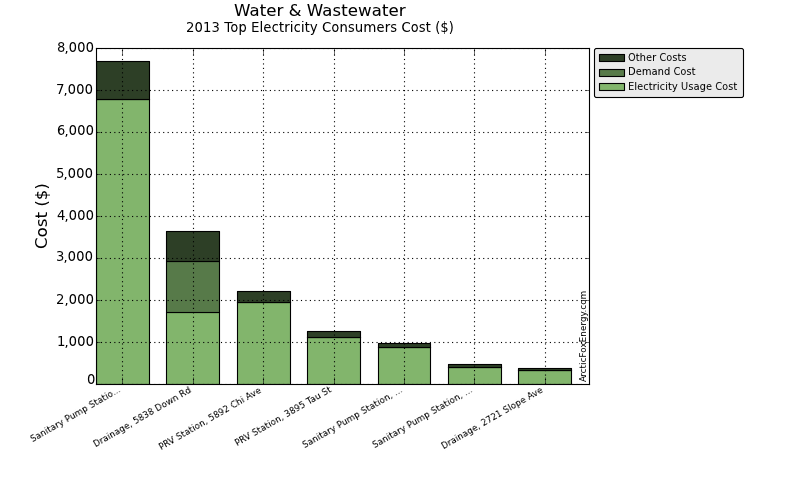
2013 Top Electricity Consumers Data
| Consumer Name | Elec Usage (kWh) | Elec Cost ($) | Demand Cost ($) | Total Elec Cost ($) |
|---|---|---|---|---|
| Sanitary Pump Statio... | 96,336.98 | 6,778.46 | 14.04 | 7,680.95 |
| Drainage, 5838 Down Rd | 22,833.28 | 1,706.78 | 1,223.50 | 3,640.01 |
| PRV Station, 5892 Chi Ave | 26,951.66 | 1,957.10 | 0.00 | 2,210.09 |
| PRV Station, 3895 Tau St | 14,903.42 | 1,109.78 | 0.00 | 1,254.38 |
| Sanitary Pump Station, ... | 11,493.85 | 869.51 | 0.00 | 977.57 |
| Sanitary Pump Station, ... | 5,361.43 | 411.09 | 0.00 | 467.12 |
| Drainage, 2721 Slope Ave | 4,410.17 | 336.58 | 0.00 | 380.06 |
| Total | 182,290.78 | 13,169.30 | 1,237.54 | 16,610.18 |
Download Top Electricity Consumers Data as a CSV file for import into Excel.
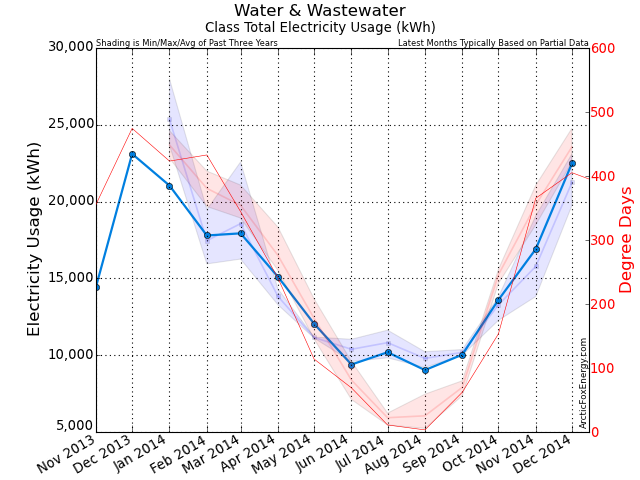
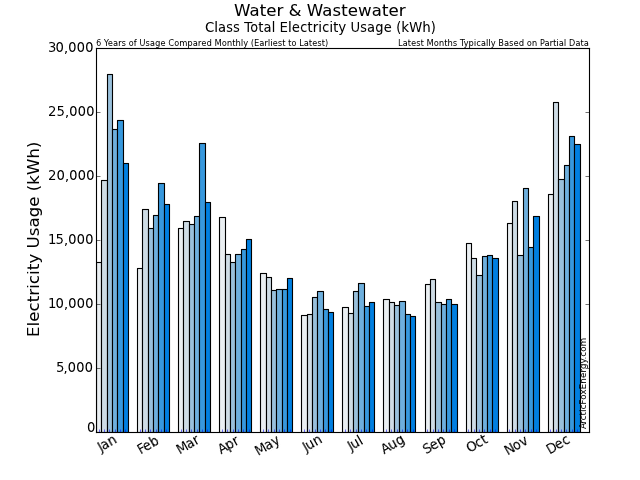
Monthly Electricity Data
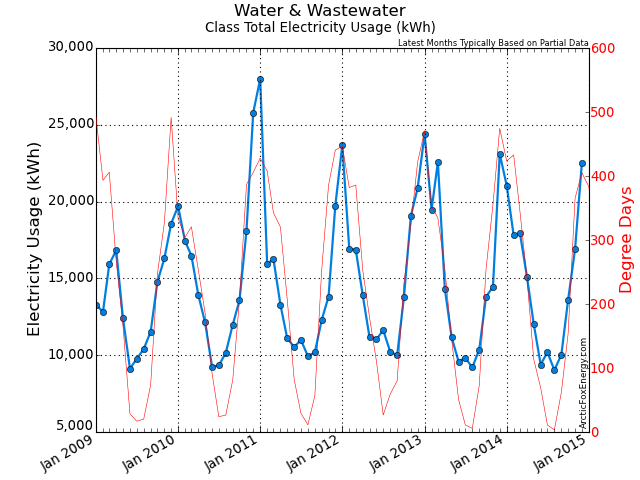
| Date | Adj Elec Usage (kWh) | Read Usage (kWh) | Elec Cost ($) | Demand Cost ($) | PF Cost ($) | Total Elec Cost ($) | GHG (tCO2e) |
|---|---|---|---|---|---|---|---|
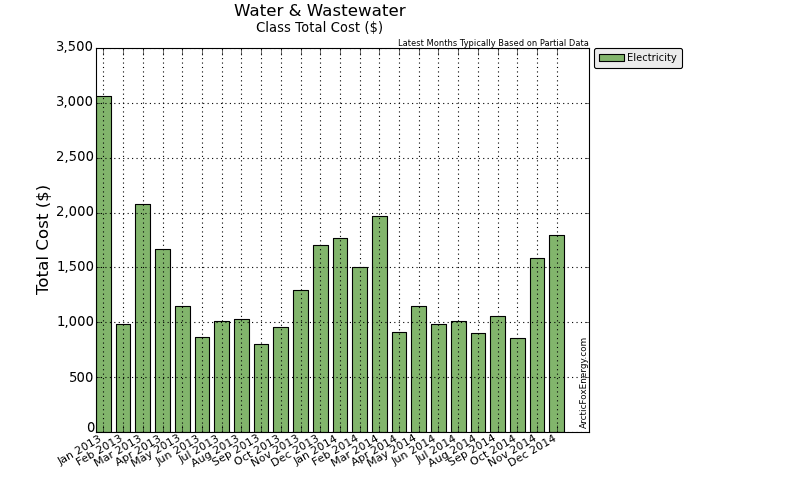
| Jan 2013 | 24,395.14 | 35,512.30 | 2,534.76 | 167.51 | 0.00 | 3,060.14 | 0.34 |
| Feb 2013 | 19,481.88 | 11,415.78 | 809.39 | 56.76 | 9.68 | 985.75 | 0.27 |
| Mar 2013 | 22,579.09 | 23,002.71 | 1,667.50 | 169.24 | 0.00 | 2,081.29 | 0.32 |
| Apr 2013 | 14,314.88 | 17,309.68 | 1,352.45 | 109.35 | 22.47 | 1,668.95 | 0.20 |
| May 2013 | 11,174.54 | 12,198.87 | 889.54 | 92.68 | 32.98 | 1,145.73 | 0.16 |
| Jun 2013 | 9,589.09 | 9,708.37 | 630.54 | 98.70 | 33.48 | 869.88 | 0.13 |
| Jul 2013 | 9,829.45 | 11,643.56 | 750.43 | 92.84 | 39.34 | 1,009.09 | 0.14 |
| Aug 2013 | 9,201.79 | 10,595.02 | 775.69 | 97.09 | 38.27 | 1,034.35 | 0.13 |
| Sep 2013 | 10,367.70 | 8,340.57 | 578.18 | 94.48 | 42.45 | 804.88 | 0.15 |
| Oct 2013 | 13,797.63 | 10,279.33 | 780.60 | 35.49 | 35.54 | 954.34 | 0.19 |
| Nov 2013 | 14,453.31 | 14,162.36 | 1,020.29 | 90.30 | 28.63 | 1,290.35 | 0.20 |
| Dec 2013 | 23,106.27 | 20,039.09 | 1,379.93 | 133.09 | 0.00 | 1,705.44 | 0.32 |
| Jan 2014 | 21,043.94 | 22,479.24 | 1,476.72 | 98.70 | 4.83 | 1,770.31 | 0.21 |
| Feb 2014 | 17,793.83 | 18,258.79 | 1,289.34 | 47.97 | 5.04 | 1,501.87 | 0.18 |
| Mar 2014 | 17,933.36 | 25,583.64 | 1,736.29 | 0.00 | 19.38 | 1,964.68 | 0.18 |
| Apr 2014 | 15,106.69 | 10,494.37 | 795.93 | 0.00 | 18.74 | 908.40 | 0.15 |
| May 2014 | 12,047.94 | 13,399.74 | 995.44 | 0.00 | 24.86 | 1,144.91 | 0.12 |
| Jun 2014 | 9,392.77 | 8,781.29 | 770.44 | 78.22 | 38.84 | 986.96 | 0.09 |
| Jul 2014 | 10,191.49 | 10,556.10 | 794.95 | 65.83 | 44.10 | 1,011.78 | 0.10 |
| Aug 2014 | 9,030.63 | 8,506.44 | 692.79 | 74.52 | 36.60 | 900.45 | 0.09 |
| Sep 2014 | 10,034.75 | 11,343.76 | 820.39 | 81.09 | 42.25 | 1,059.99 | 0.10 |
| Oct 2014 | 13,601.61 | 9,712.70 | 739.88 | 0.00 | 26.07 | 855.20 | 0.14 |
| Nov 2014 | 16,911.22 | 17,975.02 | 1,378.95 | 0.00 | 31.01 | 1,583.69 | 0.17 |
| Dec 2014 | 22,481.20 | 19,799.68 | 1,604.14 | 0.00 | 0.00 | 1,795.59 | 0.22 |
Download Monthly Electricity Data as a CSV file for import into Excel.
Yearly Data
| Date | Gas Usage (GJ) | Total Gas Cost ($) | Elec Usage (kWh) | Total Elec Cost ($) | Total Usage (ekWh) | Total Cost ($) | GHG (tCO2e) |
|---|---|---|---|---|---|---|---|
| 2009 | 0.00 | 0.00 | 161,712.47 | 12,645.73 | 161,712.47 | 12,645.73 | 4.20 |
| 2010 | 0.00 | 0.00 | 177,819.08 | 14,634.22 | 177,819.08 | 14,634.22 | 4.62 |
| 2011 | 0.00 | 0.00 | 172,067.20 | 15,911.35 | 172,067.20 | 15,911.35 | 4.30 |
| 2012 | 0.00 | 0.00 | 179,159.27 | 15,666.76 | 179,159.27 | 15,666.76 | 4.48 |
| 2013 | 0.00 | 0.00 | 182,290.78 | 16,610.18 | 182,290.78 | 16,610.18 | 2.55 |
| 2014 | 0.00 | 0.00 | 175,569.43 | 15,483.83 | 175,569.43 | 15,483.83 | 1.76 |
Download Yearly Data as a CSV file for import into Excel.
Notes
Please view the Report Notes page for important details about this report.
If any data appears unusual, please contact info@ArcticFoxEnergy.com for a manual verification. If any anomalies are detected, they will be immediately corrected.
