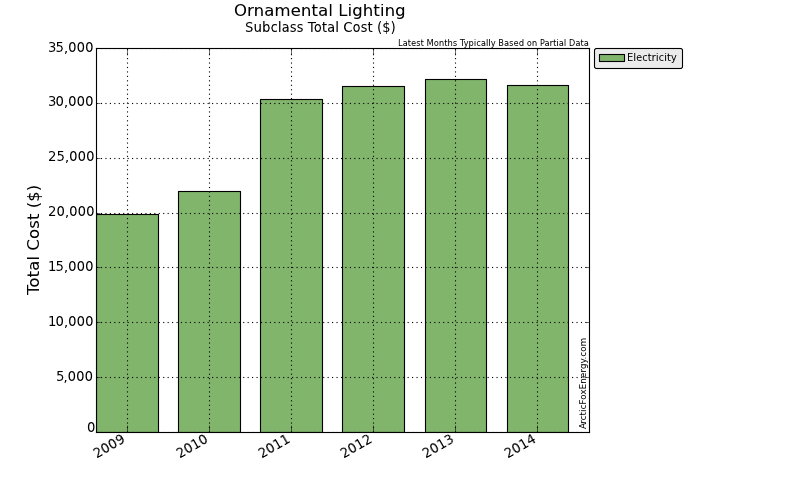
Ornamental Lighting Subclass Total
Details
This page presents the totals for all accounts in the Ornamental Lighting subclass.
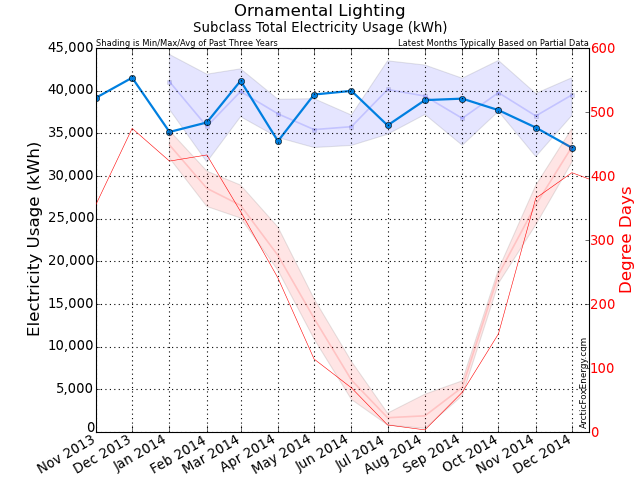
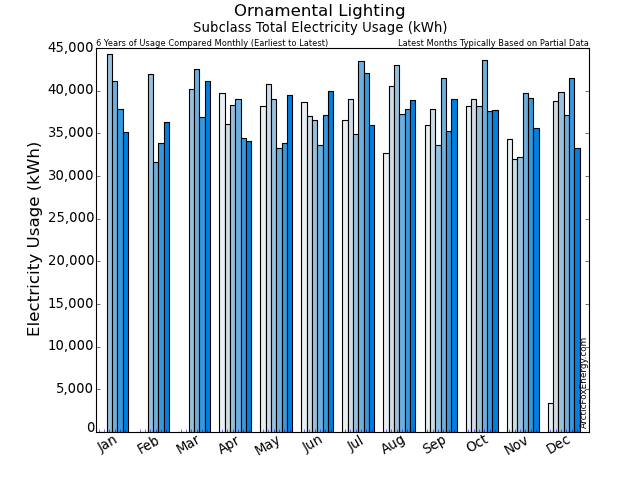
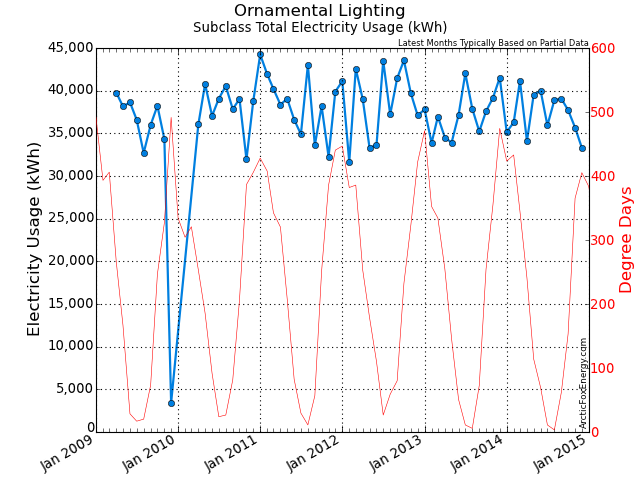
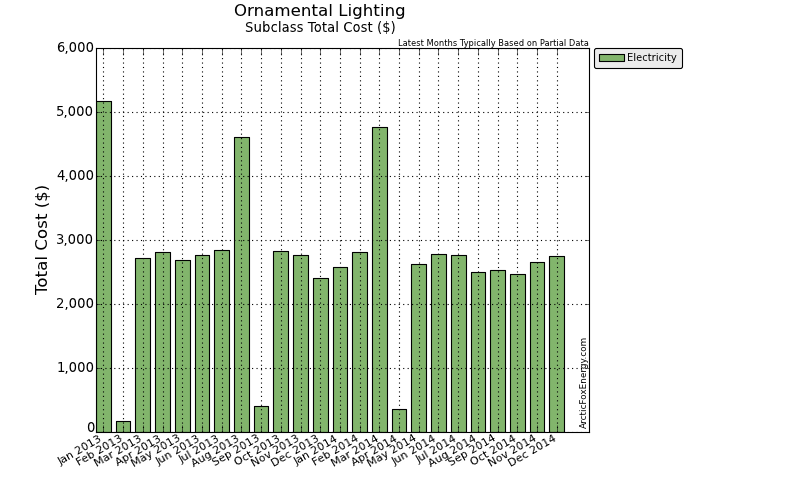
Monthly Electricity Data
| Date | Adj Elec Usage (kWh) | Read Usage (kWh) | Elec Cost ($) | Demand Cost ($) | PF Cost ($) | Total Elec Cost ($) | GHG (tCO2e) |
|---|---|---|---|---|---|---|---|
| Jan 2013 | 37,794.64 | 69,642.42 | 4,577.04 | 0.00 | 0.00 | 5,166.96 | 0.53 |
| Feb 2013 | 33,866.47 | 2,501.88 | 143.97 | 0.00 | 0.00 | 165.08 | 0.47 |
| Mar 2013 | 36,951.87 | 37,396.24 | 2,436.01 | 0.00 | 0.00 | 2,726.47 | 0.52 |
| Apr 2013 | 34,510.82 | 34,487.94 | 2,512.48 | 0.00 | 0.00 | 2,813.58 | 0.48 |
| May 2013 | 33,914.39 | 35,527.26 | 2,371.20 | 0.00 | 0.00 | 2,681.69 | 0.47 |
| Jun 2013 | 37,143.07 | 34,761.75 | 2,445.15 | 0.00 | 0.00 | 2,769.90 | 0.52 |
| Jul 2013 | 42,023.75 | 38,053.86 | 2,558.58 | 0.00 | 0.00 | 2,847.88 | 0.59 |
| Aug 2013 | 37,880.14 | 73,561.58 | 4,034.64 | 0.00 | 0.00 | 4,607.10 | 0.53 |
| Sep 2013 | 35,218.52 | 6,062.50 | 368.88 | 0.00 | 0.00 | 413.68 | 0.49 |
| Oct 2013 | 37,574.16 | 33,820.98 | 2,541.31 | 0.00 | 0.00 | 2,834.55 | 0.53 |
| Nov 2013 | 39,169.04 | 39,003.49 | 2,478.07 | 0.00 | 0.00 | 2,772.10 | 0.55 |
| Dec 2013 | 41,518.12 | 38,366.70 | 2,101.66 | 0.00 | 0.00 | 2,400.49 | 0.58 |
| Jan 2014 | 35,161.03 | 41,593.00 | 2,299.46 | 0.00 | 0.00 | 2,584.97 | 0.35 |
| Feb 2014 | 36,274.19 | 34,208.14 | 2,557.30 | 0.00 | 0.00 | 2,813.74 | 0.36 |
| Mar 2014 | 41,156.28 | 73,016.52 | 4,250.04 | 0.00 | 0.00 | 4,766.40 | 0.41 |
| Apr 2014 | 34,085.88 | 5,197.05 | 325.54 | 0.00 | 0.00 | 364.15 | 0.34 |
| May 2014 | 39,546.44 | 34,444.37 | 2,333.01 | 0.00 | 0.00 | 2,632.68 | 0.40 |
| Jun 2014 | 39,976.70 | 39,220.27 | 2,455.16 | 0.00 | 0.00 | 2,777.50 | 0.40 |
| Jul 2014 | 35,931.48 | 40,093.07 | 2,463.18 | 0.00 | 0.00 | 2,770.90 | 0.36 |
| Aug 2014 | 38,893.41 | 36,249.76 | 2,220.02 | 0.00 | 0.00 | 2,506.29 | 0.39 |
| Sep 2014 | 39,065.55 | 38,341.60 | 2,222.02 | 0.00 | 0.00 | 2,533.74 | 0.39 |
| Oct 2014 | 37,718.57 | 37,871.03 | 2,183.45 | 0.00 | 0.00 | 2,474.68 | 0.38 |
| Nov 2014 | 35,675.79 | 38,629.57 | 2,332.79 | 0.00 | 0.00 | 2,657.81 | 0.36 |
| Dec 2014 | 33,308.14 | 34,406.37 | 2,476.53 | 0.00 | 0.00 | 2,752.87 | 0.33 |
Download Monthly Electricity Data as a CSV file for import into Excel.
Yearly Data
| Date | Gas Usage (GJ) | Total Gas Cost ($) | Elec Usage (kWh) | Total Elec Cost ($) | Total Usage (ekWh) | Total Cost ($) | GHG (tCO2e) |
|---|---|---|---|---|---|---|---|
| 2009 | 0.00 | 0.00 | 297,807.16 | 19,850.35 | 297,807.16 | 19,850.35 | 7.74 |
| 2010 | 0.00 | 0.00 | 341,011.25 | 21,956.70 | 341,011.25 | 21,956.70 | 8.87 |
| 2011 | 0.00 | 0.00 | 462,252.77 | 30,365.68 | 462,252.77 | 30,365.68 | 11.56 |
| 2012 | 0.00 | 0.00 | 463,707.42 | 31,575.41 | 463,707.42 | 31,575.41 | 11.59 |
| 2013 | 0.00 | 0.00 | 447,564.98 | 32,199.48 | 447,564.98 | 32,199.48 | 6.27 |
| 2014 | 0.00 | 0.00 | 446,793.45 | 31,635.73 | 446,793.45 | 31,635.73 | 4.47 |
Download Yearly Data as a CSV file for import into Excel.
Notes
Please view the Report Notes page for important details about this report.
If any data appears unusual, please contact info@ArcticFoxEnergy.com for a manual verification. If any anomalies are detected, they will be immediately corrected.
