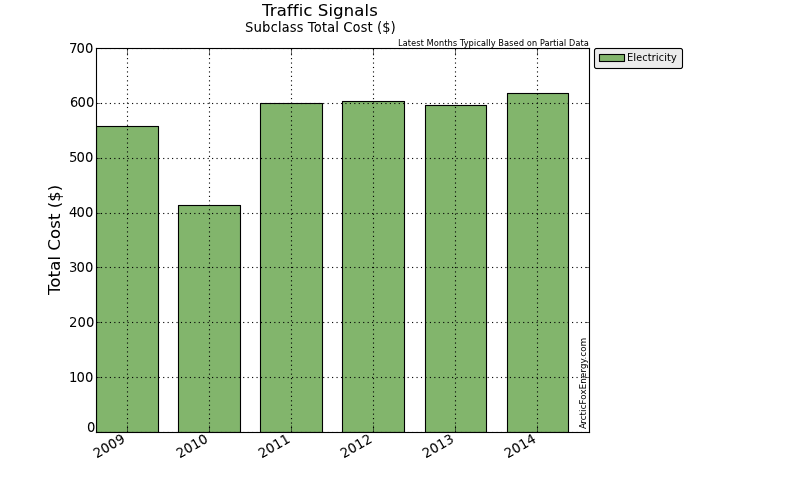
Traffic Signals Subclass Total
Details
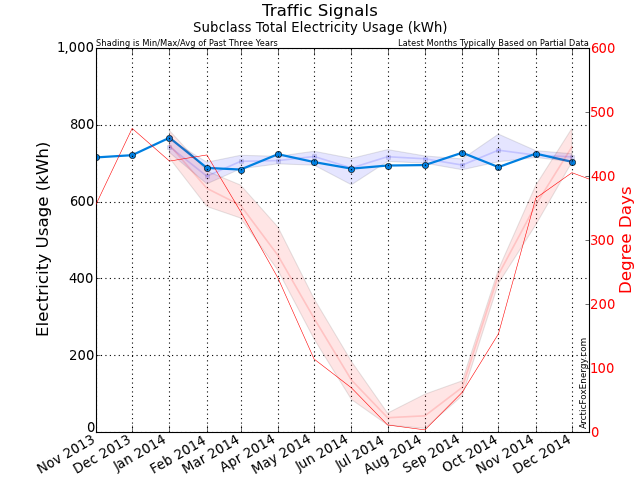
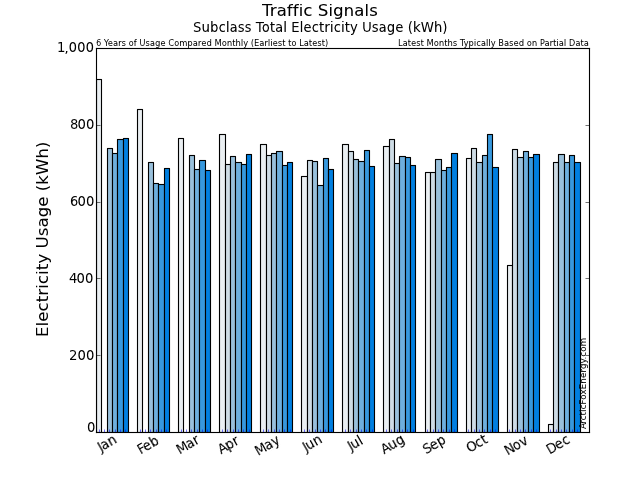
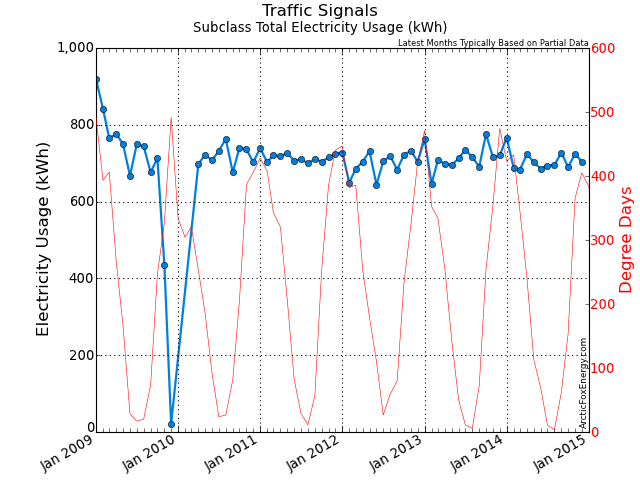
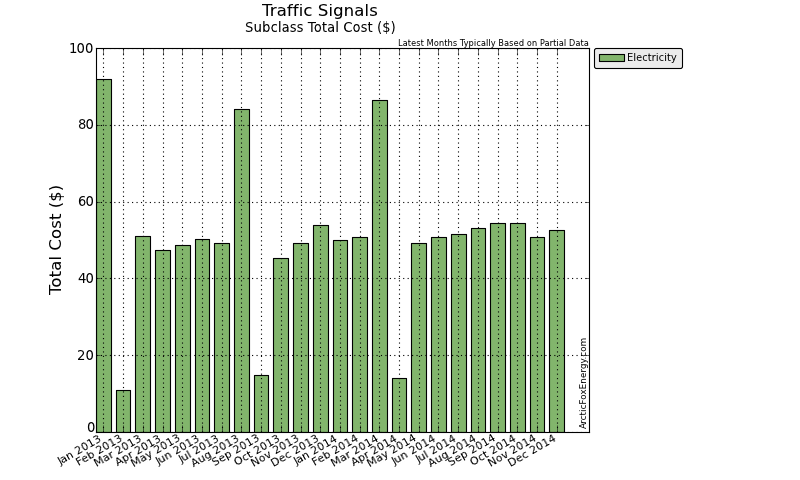
This page presents the totals for all accounts in the Traffic Signals subclass.
Monthly Electricity Data
| Date | Adj Elec Usage (kWh) | Read Usage (kWh) | Elec Cost ($) | Demand Cost ($) | PF Cost ($) | Total Elec Cost ($) | GHG (tCO2e) |
|---|---|---|---|---|---|---|---|
| Jan 2013 | 762.86 | 1,296.39 | 81.71 | 0.00 | 0.00 | 91.82 | 0.01 |
| Feb 2013 | 646.27 | 153.96 | 9.65 | 0.00 | 0.00 | 10.95 | 0.01 |
| Mar 2013 | 708.38 | 682.69 | 45.11 | 0.00 | 0.00 | 50.97 | 0.01 |
| Apr 2013 | 698.28 | 712.95 | 41.54 | 0.00 | 0.00 | 47.40 | 0.01 |
| May 2013 | 694.94 | 712.00 | 43.09 | 0.00 | 0.00 | 48.70 | 0.01 |
| Jun 2013 | 712.48 | 697.34 | 44.62 | 0.00 | 0.00 | 50.28 | 0.01 |
| Jul 2013 | 735.42 | 723.25 | 43.33 | 0.00 | 0.00 | 49.26 | 0.01 |
| Aug 2013 | 715.54 | 1,229.15 | 74.34 | 0.00 | 0.00 | 84.13 | 0.01 |
| Sep 2013 | 691.31 | 209.46 | 13.14 | 0.00 | 0.00 | 14.82 | 0.01 |
| Oct 2013 | 775.79 | 688.99 | 39.61 | 0.00 | 0.00 | 45.34 | 0.01 |
| Nov 2013 | 715.03 | 781.57 | 43.70 | 0.00 | 0.00 | 49.19 | 0.01 |
| Dec 2013 | 720.88 | 685.30 | 48.38 | 0.00 | 0.00 | 54.01 | 0.01 |
| Jan 2014 | 766.32 | 740.37 | 44.64 | 0.00 | 0.00 | 49.93 | 0.01 |
| Feb 2014 | 687.72 | 730.91 | 45.45 | 0.00 | 0.00 | 50.85 | 0.01 |
| Mar 2014 | 683.49 | 1,203.94 | 77.37 | 0.00 | 0.00 | 86.43 | 0.01 |
| Apr 2014 | 723.45 | 191.16 | 12.64 | 0.00 | 0.00 | 14.12 | 0.01 |
| May 2014 | 702.95 | 735.15 | 43.69 | 0.00 | 0.00 | 49.22 | 0.01 |
| Jun 2014 | 685.86 | 677.35 | 45.09 | 0.00 | 0.00 | 50.83 | 0.01 |
| Jul 2014 | 693.94 | 711.38 | 45.94 | 0.00 | 0.00 | 51.62 | 0.01 |
| Aug 2014 | 695.15 | 653.50 | 47.40 | 0.00 | 0.00 | 53.01 | 0.01 |
| Sep 2014 | 727.32 | 729.27 | 48.69 | 0.00 | 0.00 | 54.37 | 0.01 |
| Oct 2014 | 689.80 | 732.05 | 49.00 | 0.00 | 0.00 | 54.35 | 0.01 |
| Nov 2014 | 724.88 | 681.07 | 45.31 | 0.00 | 0.00 | 50.90 | 0.01 |
| Dec 2014 | 703.60 | 725.39 | 46.93 | 0.00 | 0.00 | 52.63 | 0.01 |
Download Monthly Electricity Data as a CSV file for import into Excel.
Yearly Data
| Date | Gas Usage (GJ) | Total Gas Cost ($) | Elec Usage (kWh) | Total Elec Cost ($) | Total Usage (ekWh) | Total Cost ($) | GHG (tCO2e) |
|---|---|---|---|---|---|---|---|
| 2009 | 0.00 | 0.00 | 8,057.57 | 558.15 | 8,057.57 | 558.15 | 0.21 |
| 2010 | 0.00 | 0.00 | 6,478.16 | 413.00 | 6,478.16 | 413.00 | 0.17 |
| 2011 | 0.00 | 0.00 | 8,578.30 | 600.58 | 8,578.30 | 600.58 | 0.21 |
| 2012 | 0.00 | 0.00 | 8,407.31 | 602.64 | 8,407.31 | 602.64 | 0.21 |
| 2013 | 0.00 | 0.00 | 8,577.19 | 596.88 | 8,577.19 | 596.88 | 0.12 |
| 2014 | 0.00 | 0.00 | 8,484.47 | 618.25 | 8,484.47 | 618.25 | 0.08 |
Download Yearly Data as a CSV file for import into Excel.
Notes
Please view the Report Notes page for important details about this report.
If any data appears unusual, please contact info@ArcticFoxEnergy.com for a manual verification. If any anomalies are detected, they will be immediately corrected.
