Lighting Class Total
Details
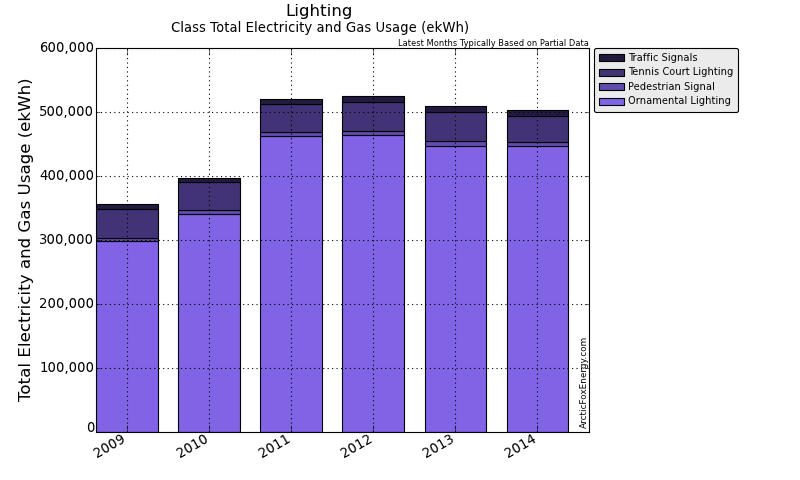
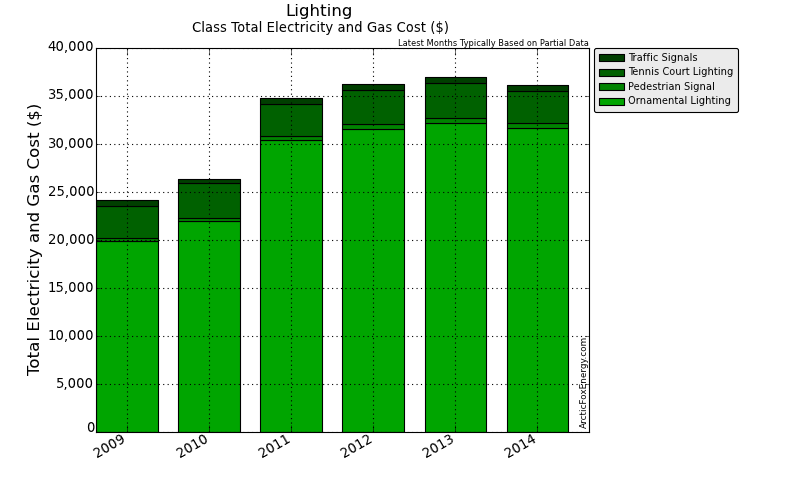
This page presents the totals for all accounts in the Lighting class.
Total Electricity and Gas Usage Data
| Date | 2012 | 2013 | 2014 |
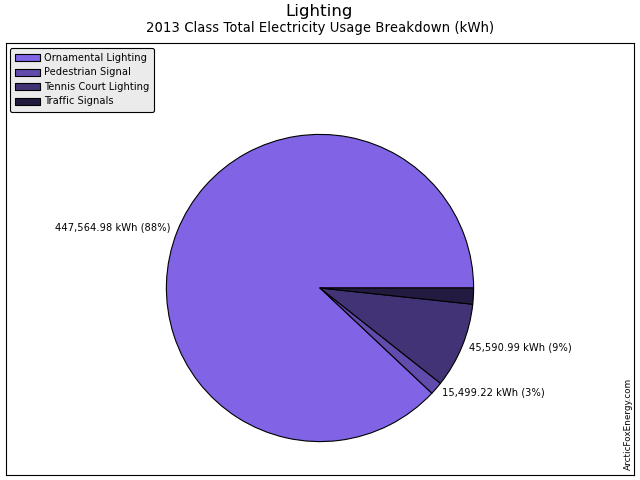
| Ornamental Lighting Usage (ekWh) | 463,707.42 | 447,564.98 | 446,793.45 |
| Pedestrian Signal Usage (ekWh) | 7,032.12 | 6,922.03 | 6,961.35 |
| Tennis Court Lighting Usage (ekWh) | 45,283.20 | 45,590.99 | 40,617.48 |
| Traffic Signals Usage (ekWh) | 8,407.31 | 8,577.19 | 8,484.47 |
| Total Usage (ekWh) | 524,430.05 | 508,655.19 | 502,856.76 |
Download Total Electricity and Gas Usage Data as a CSV file for import into Excel.
Total Electricity and Gas Cost Data
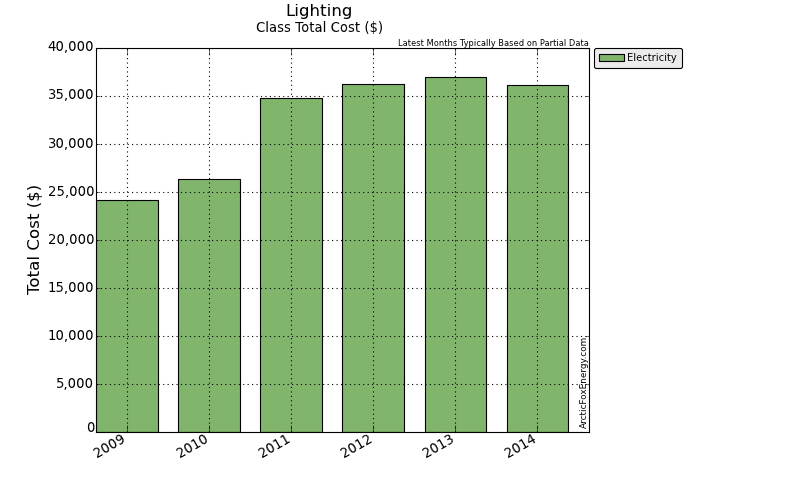
| Date | 2012 | 2013 | 2014 |
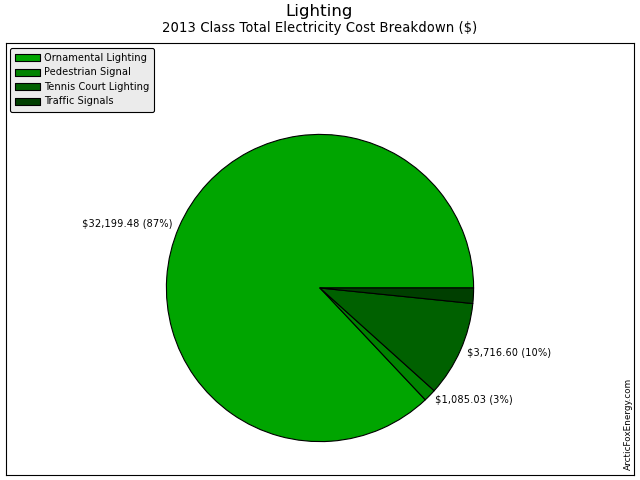
| Ornamental Lighting Cost ($) | 31,575.41 | 32,199.48 | 31,635.73 |
| Pedestrian Signal Cost ($) | 496.24 | 488.15 | 513.05 |
| Tennis Court Lighting Cost ($) | 3,590.25 | 3,716.60 | 3,385.25 |
| Traffic Signals Cost ($) | 602.64 | 596.88 | 618.25 |
| Total Cost ($) | 36,264.54 | 37,001.11 | 36,152.28 |
Download Total Electricity and Gas Cost Data as a CSV file for import into Excel.
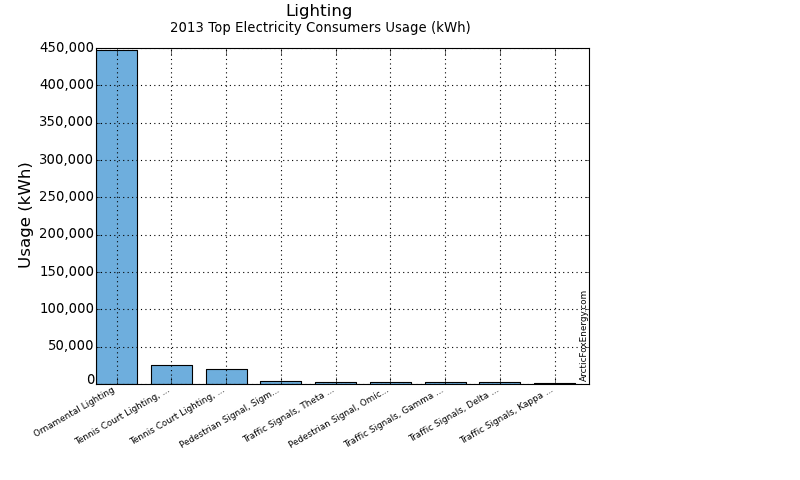
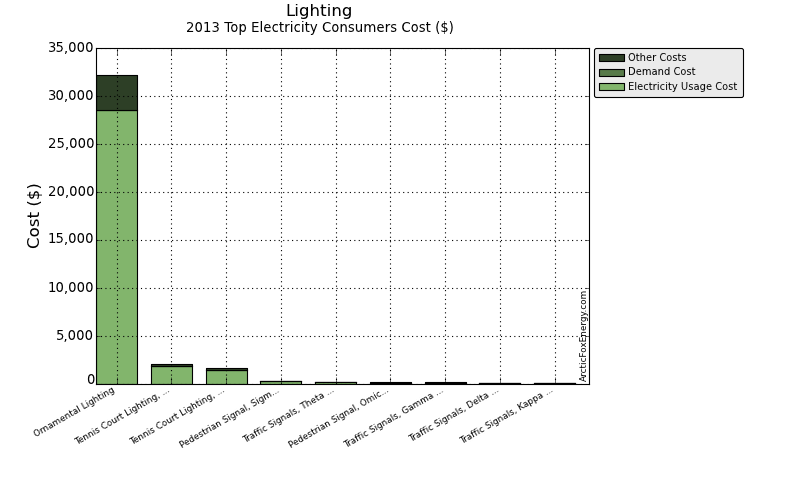
2013 Top Electricity Consumers Data
| Consumer Name | Elec Usage (kWh) | Elec Cost ($) | Demand Cost ($) | Total Elec Cost ($) |
|---|---|---|---|---|
| Ornamental Lighting | 447,564.98 | 28,568.99 | 0.00 | 32,199.48 |
| Tennis Court Lighting, ... | 25,825.38 | 1,831.58 | 0.00 | 2,077.07 |
| Tennis Court Lighting, ... | 19,765.61 | 1,456.24 | 0.00 | 1,639.53 |
| Pedestrian Signal, Sigm... | 4,467.17 | 275.78 | 0.00 | 312.04 |
| Traffic Signals, Theta ... | 2,529.02 | 156.37 | 0.00 | 176.56 |
| Pedestrian Signal, Omic... | 2,454.86 | 155.18 | 0.00 | 176.12 |
| Traffic Signals, Gamma ... | 2,179.04 | 138.32 | 0.00 | 156.35 |
| Traffic Signals, Delta ... | 2,011.93 | 118.14 | 0.00 | 133.59 |
| Traffic Signals, Kappa ... | 1,857.19 | 115.37 | 0.00 | 130.38 |
| Total | 508,655.19 | 32,815.98 | 0.00 | 37,001.11 |
Download Top Electricity Consumers Data as a CSV file for import into Excel.
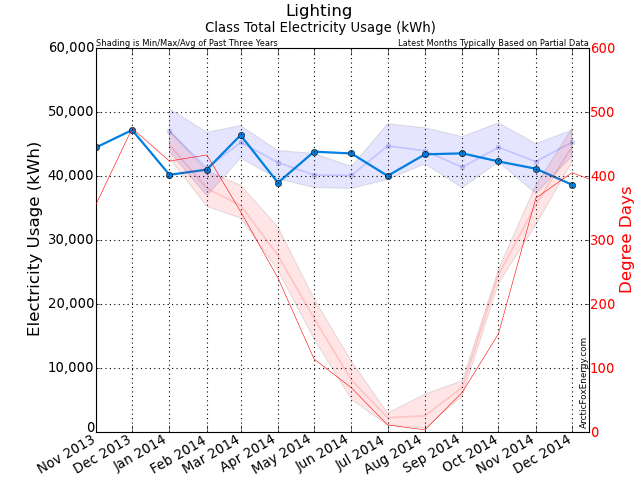
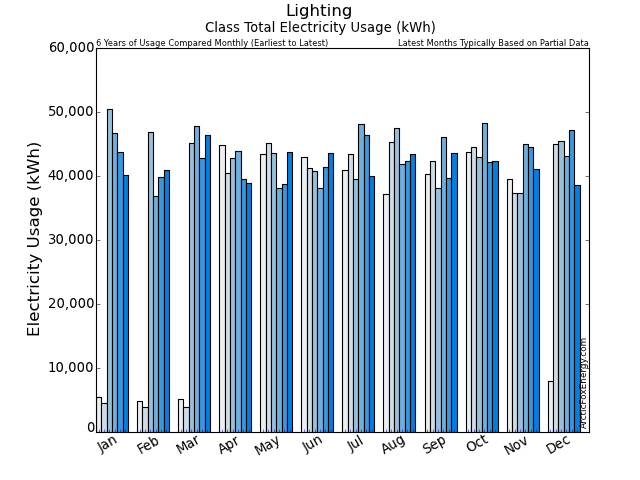
Monthly Electricity Data
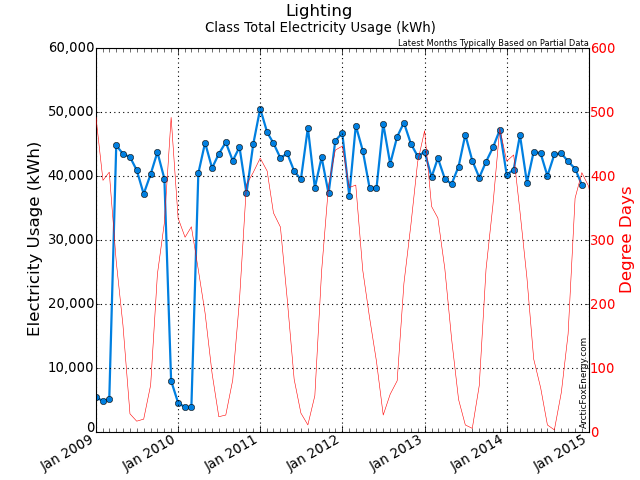
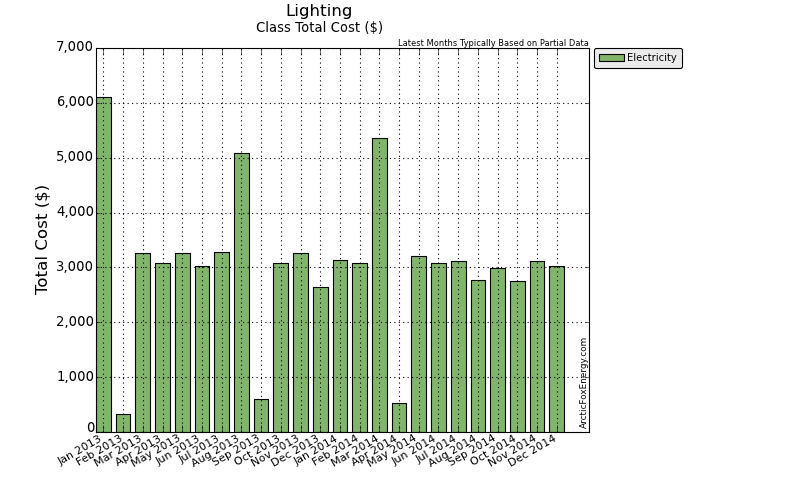
| Date | Adj Elec Usage (kWh) | Read Usage (kWh) | Elec Cost ($) | Demand Cost ($) | PF Cost ($) | Total Elec Cost ($) | GHG (tCO2e) |
|---|---|---|---|---|---|---|---|
| Jan 2013 | 43,781.75 | 80,840.79 | 5,413.73 | 0.00 | 0.00 | 6,108.41 | 0.61 |
| Feb 2013 | 39,840.07 | 4,567.28 | 287.10 | 0.00 | 0.00 | 326.36 | 0.56 |
| Mar 2013 | 42,789.95 | 44,740.23 | 2,906.71 | 0.00 | 0.00 | 3,259.25 | 0.60 |
| Apr 2013 | 39,553.44 | 37,944.12 | 2,745.28 | 0.00 | 0.00 | 3,076.80 | 0.55 |
| May 2013 | 38,742.55 | 42,458.44 | 2,885.30 | 0.00 | 0.00 | 3,257.00 | 0.54 |
| Jun 2013 | 41,480.14 | 37,902.33 | 2,673.49 | 0.00 | 0.00 | 3,028.11 | 0.58 |
| Jul 2013 | 46,458.81 | 43,578.40 | 2,933.22 | 0.00 | 0.00 | 3,274.70 | 0.65 |
| Aug 2013 | 42,393.82 | 80,067.97 | 4,455.21 | 0.00 | 0.00 | 5,084.43 | 0.59 |
| Sep 2013 | 39,759.33 | 8,625.34 | 532.57 | 0.00 | 0.00 | 598.65 | 0.56 |
| Oct 2013 | 42,212.85 | 36,973.48 | 2,751.95 | 0.00 | 0.00 | 3,077.19 | 0.59 |
| Nov 2013 | 44,461.62 | 45,338.57 | 2,912.09 | 0.00 | 0.00 | 3,259.96 | 0.62 |
| Dec 2013 | 47,180.88 | 41,818.57 | 2,319.32 | 0.00 | 0.00 | 2,650.25 | 0.66 |
| Jan 2014 | 40,184.75 | 48,935.33 | 2,796.80 | 0.00 | 0.00 | 3,144.19 | 0.40 |
| Feb 2014 | 41,002.59 | 37,514.58 | 2,796.61 | 0.00 | 0.00 | 3,079.51 | 0.41 |
| Mar 2014 | 46,385.64 | 80,863.36 | 4,784.78 | 0.00 | 0.00 | 5,368.27 | 0.46 |
| Apr 2014 | 38,951.08 | 7,129.79 | 468.42 | 0.00 | 0.00 | 524.95 | 0.39 |
| May 2014 | 43,804.25 | 41,324.61 | 2,840.23 | 0.00 | 0.00 | 3,202.22 | 0.44 |
| Jun 2014 | 43,519.23 | 42,410.85 | 2,719.74 | 0.00 | 0.00 | 3,072.93 | 0.44 |
| Jul 2014 | 40,017.05 | 44,071.82 | 2,771.34 | 0.00 | 0.00 | 3,115.26 | 0.40 |
| Aug 2014 | 43,383.34 | 39,704.55 | 2,453.23 | 0.00 | 0.00 | 2,770.99 | 0.43 |
| Sep 2014 | 43,538.73 | 43,696.08 | 2,628.12 | 0.00 | 0.00 | 2,986.50 | 0.44 |
| Oct 2014 | 42,277.82 | 41,588.18 | 2,427.21 | 0.00 | 0.00 | 2,748.66 | 0.42 |
| Nov 2014 | 41,141.92 | 44,125.67 | 2,735.95 | 0.00 | 0.00 | 3,109.01 | 0.41 |
| Dec 2014 | 38,650.35 | 37,651.18 | 2,722.26 | 0.00 | 0.00 | 3,029.81 | 0.39 |
Download Monthly Electricity Data as a CSV file for import into Excel.
Yearly Data
| Date | Gas Usage (GJ) | Total Gas Cost ($) | Elec Usage (kWh) | Total Elec Cost ($) | Total Usage (ekWh) | Total Cost ($) | GHG (tCO2e) |
|---|---|---|---|---|---|---|---|
| 2009 | 0.00 | 0.00 | 356,323.59 | 24,116.33 | 356,323.59 | 24,116.33 | 9.26 |
| 2010 | 0.00 | 0.00 | 397,016.18 | 26,377.98 | 397,016.18 | 26,377.98 | 10.32 |
| 2011 | 0.00 | 0.00 | 520,496.56 | 34,745.04 | 520,496.56 | 34,745.04 | 13.01 |
| 2012 | 0.00 | 0.00 | 524,430.05 | 36,264.54 | 524,430.05 | 36,264.54 | 13.11 |
| 2013 | 0.00 | 0.00 | 508,655.19 | 37,001.11 | 508,655.19 | 37,001.11 | 7.12 |
| 2014 | 0.00 | 0.00 | 502,856.76 | 36,152.28 | 502,856.76 | 36,152.28 | 5.03 |
Download Yearly Data as a CSV file for import into Excel.
Notes
Please view the Report Notes page for important details about this report.
If any data appears unusual, please contact info@ArcticFoxEnergy.com for a manual verification. If any anomalies are detected, they will be immediately corrected.
