City Staff Offices Subclass Total
Details
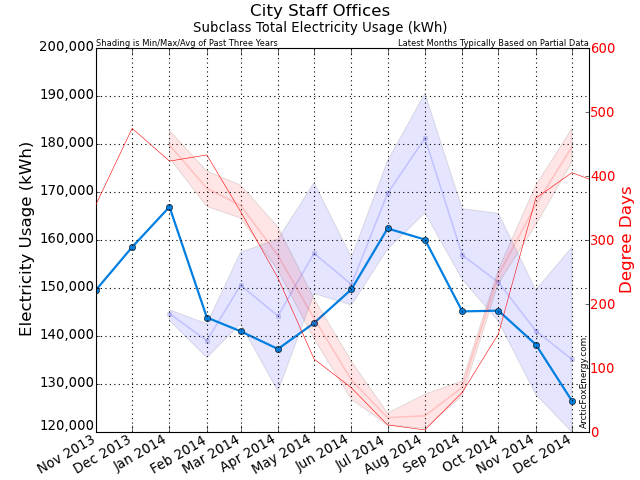
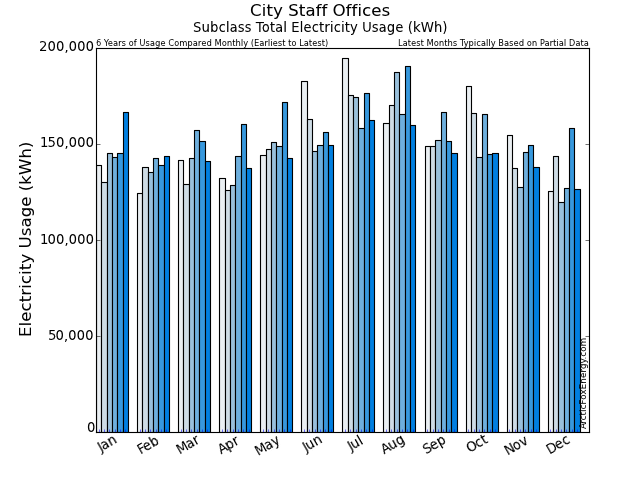
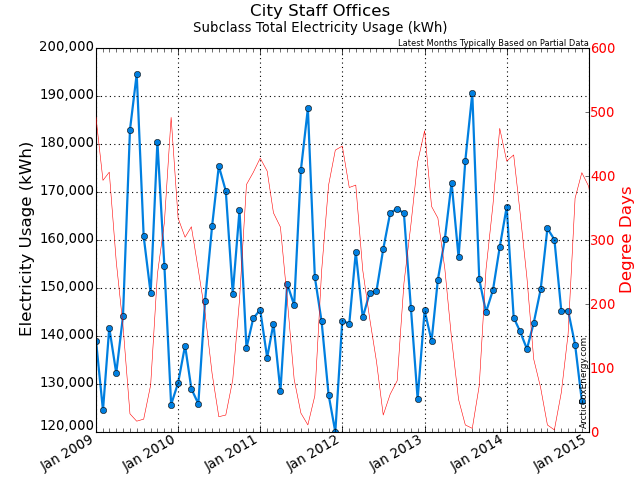
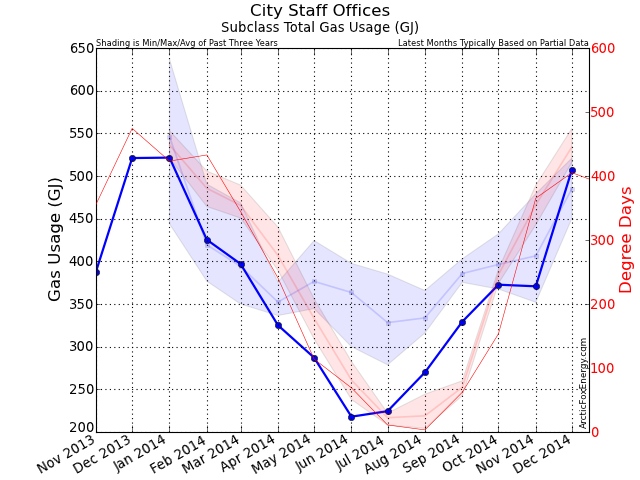
This page presents the totals for all accounts in the City Staff Offices subclass.
Monthly Electricity Data
| Date | Adj Elec Usage (kWh) | Read Usage (kWh) | Elec Cost ($) | Demand Cost ($) | PF Cost ($) | Total Elec Cost ($) | GHG (tCO2e) |
|---|---|---|---|---|---|---|---|
| Jan 2013 | 145,317.28 | 116,441.14 | 5,363.53 | 1,366.46 | 0.00 | 7,517.49 | 2.03 |
| Feb 2013 | 139,004.58 | 150,807.69 | 4,730.02 | 1,225.79 | 0.00 | 6,747.72 | 1.95 |
| Mar 2013 | 151,734.73 | 149,429.30 | 4,606.92 | 1,317.86 | 0.00 | 6,745.50 | 2.12 |
| Apr 2013 | 160,211.81 | 153,767.25 | 5,070.08 | 1,420.55 | 0.00 | 7,352.97 | 2.24 |
| May 2013 | 171,952.08 | 161,941.87 | 5,043.59 | 1,761.51 | 0.00 | 7,696.44 | 2.41 |
| Jun 2013 | 156,384.82 | 182,594.48 | 6,149.85 | 2,100.40 | 0.00 | 9,347.49 | 2.19 |
| Jul 2013 | 176,534.23 | 143,966.24 | 5,542.78 | 1,781.90 | 0.00 | 8,293.22 | 2.47 |
| Aug 2013 | 190,563.40 | 203,379.91 | 6,572.48 | 2,039.78 | 0.00 | 9,815.18 | 2.67 |
| Sep 2013 | 151,772.62 | 177,822.95 | 6,321.23 | 2,047.52 | 0.00 | 9,434.92 | 2.12 |
| Oct 2013 | 144,972.63 | 143,349.64 | 6,470.57 | 1,632.98 | 0.00 | 9,175.89 | 2.03 |
| Nov 2013 | 149,595.78 | 149,371.18 | 5,032.43 | 1,252.07 | 0.00 | 7,179.73 | 2.09 |
| Dec 2013 | 158,526.44 | 134,996.29 | 5,009.32 | 1,339.81 | 0.00 | 7,126.10 | 2.22 |
| Jan 2014 | 166,903.99 | 160,226.52 | 5,437.86 | 1,584.66 | 0.00 | 7,898.94 | 1.67 |
| Feb 2014 | 143,852.97 | 176,349.78 | 5,240.31 | 1,293.66 | 0.00 | 7,366.19 | 1.44 |
| Mar 2014 | 140,985.56 | 133,140.90 | 5,319.85 | 1,599.24 | 0.00 | 7,745.95 | 1.41 |
| Apr 2014 | 137,297.76 | 149,102.27 | 5,889.92 | 1,465.48 | 0.00 | 8,127.05 | 1.37 |
| May 2014 | 142,703.29 | 128,923.78 | 4,922.07 | 1,560.51 | 0.00 | 7,336.09 | 1.43 |
| Jun 2014 | 149,721.88 | 142,858.37 | 5,613.12 | 1,912.87 | 0.00 | 8,549.24 | 1.50 |
| Jul 2014 | 162,404.57 | 151,905.30 | 5,843.11 | 1,780.77 | 0.00 | 8,572.41 | 1.62 |
| Aug 2014 | 160,091.24 | 167,894.58 | 7,487.01 | 2,602.38 | 0.00 | 11,186.23 | 1.60 |
| Sep 2014 | 145,124.54 | 153,135.58 | 6,080.77 | 2,114.31 | 0.00 | 9,121.47 | 1.45 |
| Oct 2014 | 145,277.19 | 154,693.43 | 7,756.03 | 1,896.71 | 0.00 | 10,703.29 | 1.45 |
| Nov 2014 | 138,228.56 | 140,333.13 | 6,869.79 | 0.00 | 0.00 | 7,869.31 | 1.38 |
| Dec 2014 | 126,494.09 | 127,718.39 | 6,615.06 | 0.00 | 0.00 | 7,544.42 | 1.26 |
Download Monthly Electricity Data as a CSV file for import into Excel.
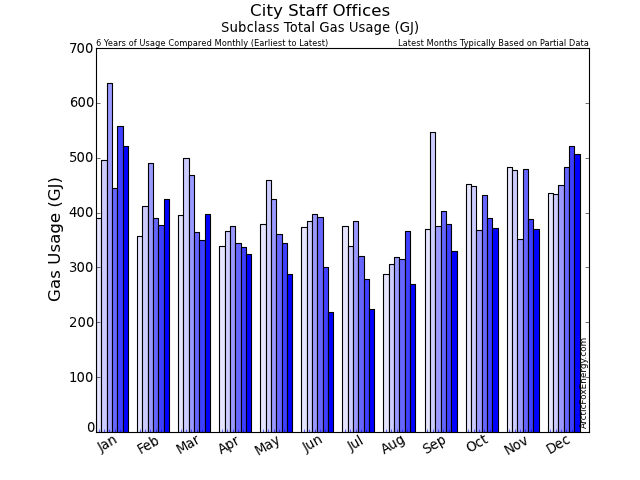
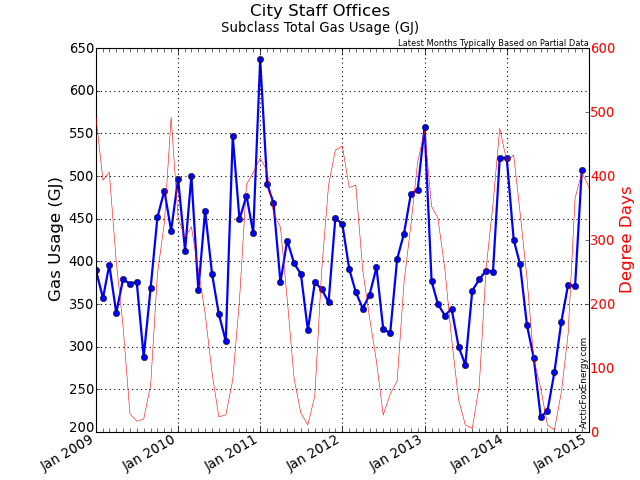
Monthly Gas Data
| Date | Adj Gas Usage (GJ) | Read Usage (GJ) | Gas Cost ($) | Basic / Mgmt Cost ($) | Delivery Cost ($) | Midstream Cost ($) | Total Gas Cost ($) | GHG (tCO2e) |
|---|---|---|---|---|---|---|---|---|
| Jan 2013 | 557.67 | 557.67 | 3,912.91 | 53.46 | 0.00 | 0.00 | 4,573.40 | 27.74 |
| Feb 2013 | 376.77 | 376.77 | 3,692.26 | 43.30 | 0.00 | 0.00 | 4,226.42 | 18.74 |
| Mar 2013 | 350.00 | 350.00 | 3,392.44 | 35.73 | 0.00 | 0.00 | 3,879.06 | 17.41 |
| Apr 2013 | 336.49 | 336.49 | 2,623.77 | 30.05 | 0.00 | 0.00 | 2,993.42 | 16.74 |
| May 2013 | 344.58 | 344.58 | 2,159.30 | 32.90 | 0.00 | 0.00 | 2,524.27 | 17.14 |
| Jun 2013 | 300.00 | 300.00 | 2,793.22 | 39.16 | 0.00 | 0.00 | 3,154.49 | 14.93 |
| Jul 2013 | 278.75 | 278.75 | 2,354.28 | 27.54 | 0.00 | 0.00 | 2,661.51 | 13.87 |
| Aug 2013 | 365.78 | 365.78 | 2,576.25 | 33.54 | 0.00 | 0.00 | 2,968.88 | 18.20 |
| Sep 2013 | 378.74 | 378.74 | 2,526.03 | 37.10 | 0.00 | 0.00 | 2,932.68 | 18.84 |
| Oct 2013 | 389.26 | 389.26 | 2,966.85 | 42.35 | 0.00 | 0.00 | 3,394.06 | 19.37 |
| Nov 2013 | 388.02 | 388.02 | 2,898.13 | 46.96 | 0.00 | 0.00 | 3,353.15 | 19.30 |
| Dec 2013 | 521.03 | 521.03 | 4,296.61 | 53.23 | 0.00 | 0.00 | 4,887.83 | 25.92 |
| Jan 2014 | 521.53 | 506.34 | 3,437.60 | 48.20 | 0.00 | 0.00 | 3,967.07 | 25.95 |
| Feb 2014 | 425.30 | 440.49 | 2,822.95 | 46.61 | 0.00 | 0.00 | 3,256.89 | 21.16 |
| Mar 2014 | 396.95 | 396.95 | 2,818.40 | 40.18 | 0.00 | 0.00 | 3,276.64 | 19.75 |
| Apr 2014 | 325.14 | 325.14 | 2,786.26 | 36.28 | 0.00 | 0.00 | 3,172.33 | 16.18 |
| May 2014 | 287.18 | 287.18 | 2,008.97 | 31.75 | 0.00 | 0.00 | 2,312.78 | 14.29 |
| Jun 2014 | 217.95 | 217.95 | 1,388.67 | 24.24 | 0.00 | 0.00 | 1,699.43 | 10.84 |
| Jul 2014 | 224.43 | 224.43 | 1,732.23 | 22.23 | 0.00 | 0.00 | 2,099.23 | 11.17 |
| Aug 2014 | 269.88 | 269.88 | 1,706.93 | 28.33 | 0.00 | 0.00 | 2,118.73 | 13.43 |
| Sep 2014 | 329.26 | 329.26 | 2,329.53 | 32.98 | 0.00 | 0.00 | 2,787.75 | 16.38 |
| Oct 2014 | 372.62 | 372.62 | 2,397.84 | 39.52 | 0.00 | 0.00 | 2,961.31 | 18.54 |
| Nov 2014 | 370.73 | 370.73 | 4,789.34 | 38.55 | 0.00 | 0.00 | 5,594.86 | 18.44 |
| Dec 2014 | 507.39 | 507.39 | 5,350.87 | 50.16 | 0.00 | 0.00 | 6,313.99 | 25.24 |
Download Monthly Gas Data as a CSV file for import into Excel.
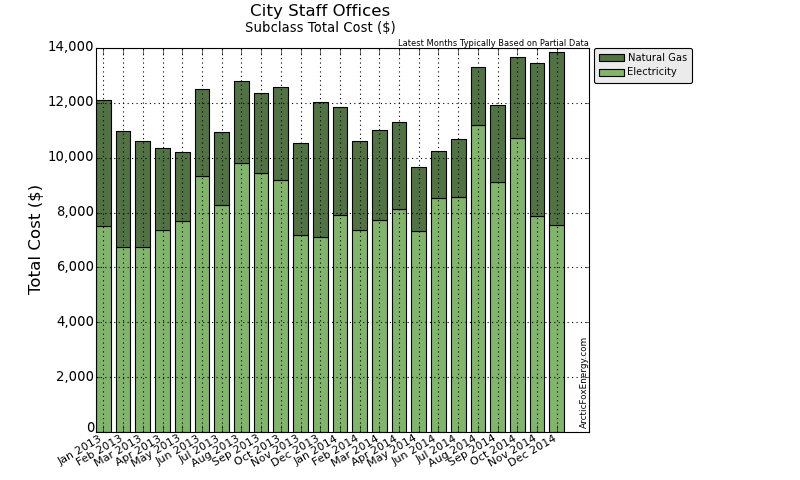
Monthly Total Data
| Date | Adj Gas Usage (GJ) | Total Gas Cost ($) | Adj Elec Usage (kWh) | Total Elec Cost ($) | Total Usage (ekWh) | Total Cost ($) | GHG (tCO2e) |
|---|---|---|---|---|---|---|---|
| Jan 2013 | 557.67 | 4,573.40 | 145,317.28 | 7,517.49 | 300,224.61 | 12,090.88 | 29.78 |
| Feb 2013 | 376.77 | 4,226.42 | 139,004.58 | 6,747.72 | 243,661.84 | 10,974.14 | 20.69 |
| Mar 2013 | 350.00 | 3,879.06 | 151,734.73 | 6,745.50 | 248,956.95 | 10,624.55 | 19.54 |
| Apr 2013 | 336.49 | 2,993.42 | 160,211.81 | 7,352.97 | 253,682.47 | 10,346.39 | 18.98 |
| May 2013 | 344.58 | 2,524.27 | 171,952.08 | 7,696.44 | 267,669.07 | 10,220.71 | 19.55 |
| Jun 2013 | 300.00 | 3,154.49 | 156,384.82 | 9,347.49 | 239,718.15 | 12,501.98 | 17.11 |
| Jul 2013 | 278.75 | 2,661.51 | 176,534.23 | 8,293.22 | 253,965.64 | 10,954.73 | 16.34 |
| Aug 2013 | 365.78 | 2,968.88 | 190,563.40 | 9,815.18 | 292,169.10 | 12,784.06 | 20.87 |
| Sep 2013 | 378.74 | 2,932.68 | 151,772.62 | 9,434.92 | 256,979.07 | 12,367.59 | 20.97 |
| Oct 2013 | 389.26 | 3,394.06 | 144,972.63 | 9,175.89 | 253,099.75 | 12,569.95 | 21.40 |
| Nov 2013 | 388.02 | 3,353.15 | 149,595.78 | 7,179.73 | 257,379.51 | 10,532.88 | 21.40 |
| Dec 2013 | 521.03 | 4,887.83 | 158,526.44 | 7,126.10 | 303,256.82 | 12,013.93 | 28.14 |
| Jan 2014 | 521.53 | 3,967.07 | 166,903.99 | 7,898.94 | 311,774.35 | 11,866.02 | 27.62 |
| Feb 2014 | 425.30 | 3,256.89 | 143,852.97 | 7,366.19 | 261,992.87 | 10,623.08 | 22.60 |
| Mar 2014 | 396.95 | 3,276.64 | 140,985.56 | 7,745.95 | 251,248.99 | 11,022.60 | 21.16 |
| Apr 2014 | 325.14 | 3,172.33 | 137,297.76 | 8,127.05 | 227,614.49 | 11,299.37 | 17.55 |
| May 2014 | 287.18 | 2,312.78 | 142,703.29 | 7,336.09 | 222,476.38 | 9,648.87 | 15.71 |
| Jun 2014 | 217.95 | 1,699.43 | 149,721.88 | 8,549.24 | 210,264.80 | 10,248.67 | 12.34 |
| Jul 2014 | 224.43 | 2,099.23 | 162,404.57 | 8,572.41 | 224,745.25 | 10,671.64 | 12.79 |
| Aug 2014 | 269.88 | 2,118.73 | 160,091.24 | 11,186.23 | 235,056.61 | 13,304.95 | 15.03 |
| Sep 2014 | 329.26 | 2,787.75 | 145,124.54 | 9,121.47 | 236,585.80 | 11,909.22 | 17.83 |
| Oct 2014 | 372.62 | 2,961.31 | 145,277.19 | 10,703.29 | 248,782.95 | 13,664.60 | 19.99 |
| Nov 2014 | 370.73 | 5,594.86 | 138,228.56 | 7,869.31 | 241,208.03 | 13,464.17 | 19.83 |
| Dec 2014 | 507.39 | 6,313.99 | 126,494.09 | 7,544.42 | 267,436.07 | 13,858.41 | 26.51 |
Download Monthly Total Data as a CSV file for import into Excel.
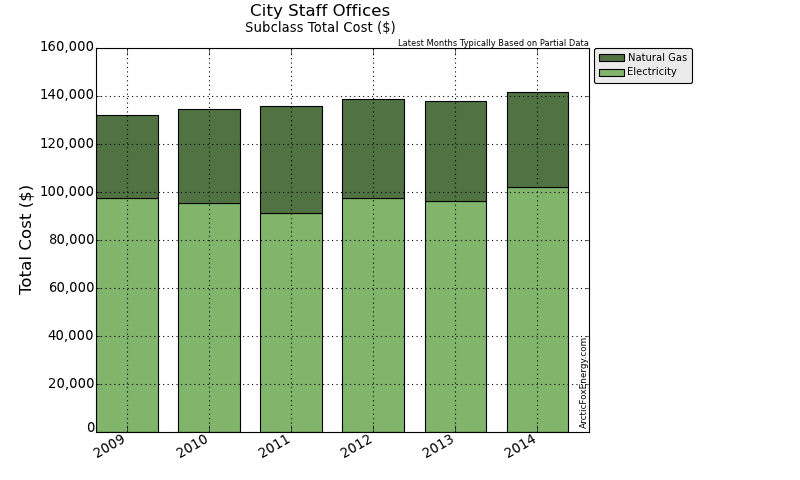
Yearly Data
| Date | Gas Usage (GJ) | Total Gas Cost ($) | Elec Usage (kWh) | Total Elec Cost ($) | Total Usage (ekWh) | Total Cost ($) | GHG (tCO2e) |
|---|---|---|---|---|---|---|---|
| 2009 | 4,637.97 | 34,613.81 | 1,829,665.69 | 97,302.14 | 3,117,991.77 | 131,915.94 | 278.31 |
| 2010 | 5,170.51 | 39,062.73 | 1,775,101.75 | 95,498.09 | 3,211,355.24 | 134,560.83 | 303.39 |
| 2011 | 5,043.04 | 44,746.31 | 1,754,381.33 | 91,151.73 | 3,155,225.98 | 135,898.03 | 294.75 |
| 2012 | 4,731.54 | 41,156.50 | 1,813,881.31 | 97,557.85 | 3,128,197.62 | 138,714.35 | 280.74 |
| 2013 | 4,587.09 | 41,549.16 | 1,896,570.39 | 96,432.63 | 3,170,763.00 | 137,981.79 | 254.76 |
| 2014 | 4,248.36 | 39,561.02 | 1,759,085.61 | 102,020.58 | 2,939,186.61 | 141,581.60 | 228.95 |
Download Yearly Data as a CSV file for import into Excel.
Metrics
Hours of Usage per Year: 8760 hours
| Date | Usage per Hour (ekWh/h) |
|---|---|
| 2009 | 355.94 |
| 2010 | 366.59 |
| 2011 | 360.19 |
| 2012 | 357.10 |
| 2013 | 361.96 |
| 2014 | 335.52 |
Download Metric Data as a CSV file for import into Excel.
Notes
Please view the Report Notes page for important details about this report.
If any data appears unusual, please contact info@ArcticFoxEnergy.com for a manual verification. If any anomalies are detected, they will be immediately corrected.
