Buildings Class Total
Details
This page presents the totals for all accounts in the Buildings class.
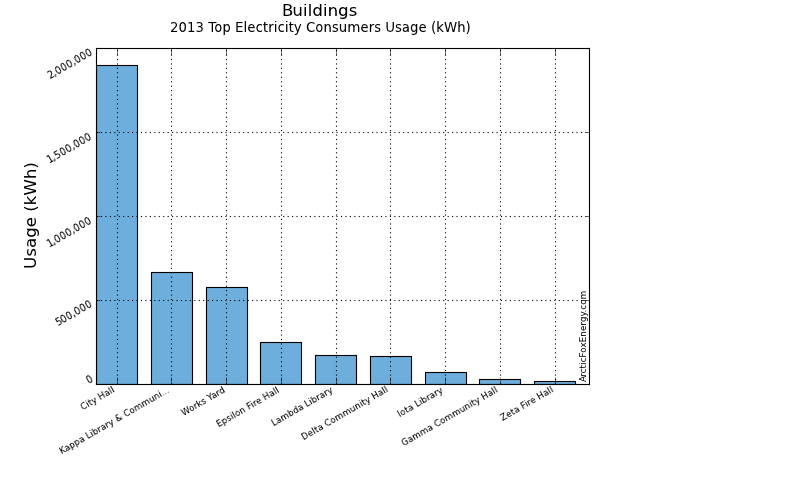
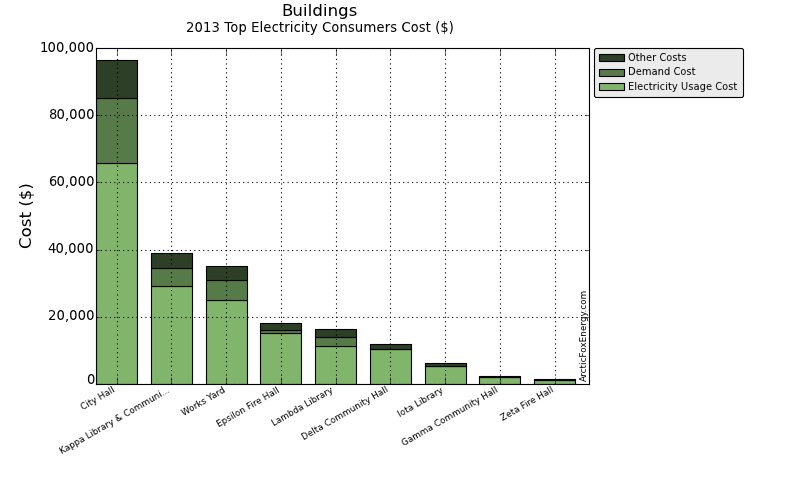
2013 Top Electricity Consumers Data
| Consumer Name | Elec Usage (kWh) | Elec Cost ($) | Demand Cost ($) | Total Elec Cost ($) |
|---|---|---|---|---|
| City Hall | 1,896,570.39 | 65,912.78 | 19,286.64 | 96,432.63 |
| Kappa Library & Communi... | 668,270.10 | 29,027.06 | 5,573.88 | 39,065.20 |
| Works Yard | 579,481.22 | 25,116.51 | 5,847.30 | 35,052.64 |
| Epsilon Fire Hall | 249,749.41 | 15,035.80 | 945.29 | 18,033.43 |
| Lambda Library | 174,675.34 | 11,364.46 | 2,514.80 | 16,301.16 |
| Delta Community Hall | 166,382.43 | 10,477.54 | 14.70 | 11,815.93 |
| Iota Library | 70,037.75 | 5,478.82 | 0.00 | 6,228.54 |
| Gamma Community Hall | 31,706.64 | 2,187.33 | 0.00 | 2,474.38 |
| Zeta Fire Hall | 15,137.71 | 1,216.39 | 0.00 | 1,372.60 |
| Total | 3,852,010.99 | 165,816.69 | 34,182.61 | 226,776.51 |
Download Top Electricity Consumers Data as a CSV file for import into Excel.
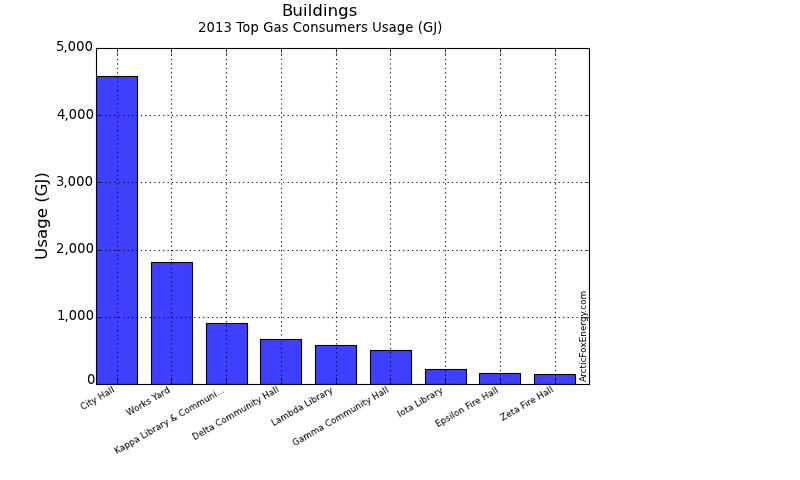
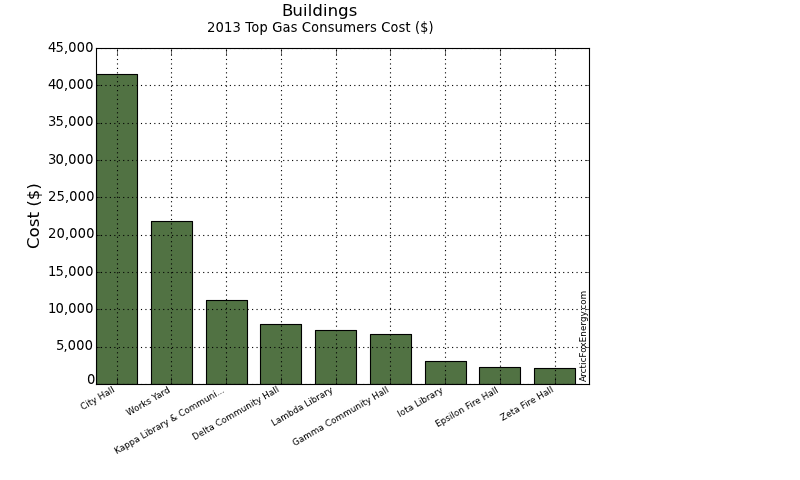
2013 Top Gas Consumers Data
| Consumer Name | Gas Usage (GJ) | Total Gas Cost ($) |
|---|---|---|
| City Hall | 4,587.09 | 41,549.16 |
| Works Yard | 1,812.26 | 21,872.70 |
| Kappa Library & Communi... | 904.33 | 11,273.13 |
| Delta Community Hall | 665.47 | 8,004.07 |
| Lambda Library | 584.66 | 7,289.75 |
| Gamma Community Hall | 506.35 | 6,748.45 |
| Iota Library | 227.72 | 3,116.11 |
| Epsilon Fire Hall | 163.43 | 2,228.20 |
| Zeta Fire Hall | 151.87 | 2,183.55 |
| Total | 9,603.17 | 104,265.12 |
Download Top Gas Consumers Data as a CSV file for import into Excel.
Monthly Electricity Data
| Date | Adj Elec Usage (kWh) | Read Usage (kWh) | Elec Cost ($) | Demand Cost ($) | PF Cost ($) | Total Elec Cost ($) | GHG (tCO2e) |
|---|---|---|---|---|---|---|---|
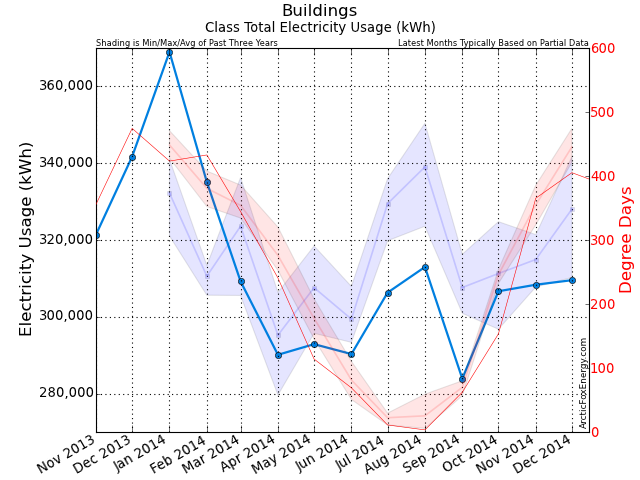
| Jan 2013 | 341,028.64 | 344,790.45 | 16,464.30 | 2,787.02 | 0.00 | 21,692.21 | 4.77 |
| Feb 2013 | 312,757.10 | 318,078.43 | 13,077.58 | 2,485.95 | 0.00 | 17,642.18 | 4.38 |
| Mar 2013 | 328,963.55 | 330,815.52 | 13,569.44 | 2,603.74 | 0.00 | 18,327.96 | 4.61 |
| Apr 2013 | 306,330.78 | 299,550.09 | 12,272.63 | 2,431.59 | 17.93 | 16,631.49 | 4.29 |
| May 2013 | 318,443.64 | 313,515.94 | 13,916.54 | 2,800.30 | 93.16 | 18,988.61 | 4.46 |
| Jun 2013 | 307,893.24 | 334,139.25 | 13,468.09 | 3,517.67 | 124.71 | 19,360.52 | 4.31 |
| Jul 2013 | 332,605.41 | 306,326.78 | 14,017.74 | 2,786.15 | 121.46 | 19,150.27 | 4.66 |
| Aug 2013 | 343,166.68 | 351,695.44 | 14,456.62 | 3,261.11 | 109.42 | 20,177.31 | 4.80 |
| Sep 2013 | 300,930.67 | 326,010.28 | 13,279.33 | 3,014.14 | 22.23 | 18,401.67 | 4.21 |
| Oct 2013 | 296,771.77 | 286,372.54 | 14,367.75 | 2,758.68 | 0.00 | 19,352.49 | 4.15 |
| Nov 2013 | 321,402.25 | 332,684.21 | 14,724.41 | 3,057.53 | 26.69 | 20,249.18 | 4.50 |
| Dec 2013 | 341,717.25 | 289,123.05 | 12,202.26 | 2,678.72 | 0.00 | 16,802.64 | 4.78 |
| Jan 2014 | 368,975.57 | 372,288.19 | 16,101.76 | 3,275.18 | 0.00 | 21,681.15 | 3.69 |
| Feb 2014 | 335,098.73 | 369,473.79 | 14,154.51 | 2,763.31 | 0.00 | 19,052.85 | 3.35 |
| Mar 2014 | 309,220.11 | 311,311.29 | 14,625.81 | 2,796.99 | 0.00 | 19,445.26 | 3.09 |
| Apr 2014 | 290,107.23 | 301,003.58 | 13,662.11 | 2,367.10 | 0.00 | 17,933.27 | 2.90 |
| May 2014 | 292,876.66 | 289,121.73 | 14,369.22 | 3,107.78 | 44.72 | 19,720.97 | 2.93 |
| Jun 2014 | 290,298.13 | 285,923.38 | 13,498.26 | 3,365.93 | 42.52 | 18,989.04 | 2.90 |
| Jul 2014 | 306,294.90 | 294,275.94 | 14,648.78 | 2,982.41 | 196.32 | 20,022.79 | 3.06 |
| Aug 2014 | 312,970.55 | 302,720.98 | 15,023.14 | 3,390.59 | 0.00 | 20,485.58 | 3.13 |
| Sep 2014 | 283,899.51 | 312,010.09 | 15,472.28 | 3,838.85 | 237.34 | 21,743.71 | 2.84 |
| Oct 2014 | 306,652.71 | 307,650.11 | 16,313.84 | 3,327.91 | -0.79 | 21,706.05 | 3.07 |
| Nov 2014 | 308,353.64 | 270,654.45 | 14,264.02 | 0.00 | 0.00 | 16,228.26 | 3.08 |
| Dec 2014 | 309,538.13 | 346,937.57 | 20,438.46 | 0.00 | 0.00 | 23,265.18 | 3.10 |
Download Monthly Electricity Data as a CSV file for import into Excel.
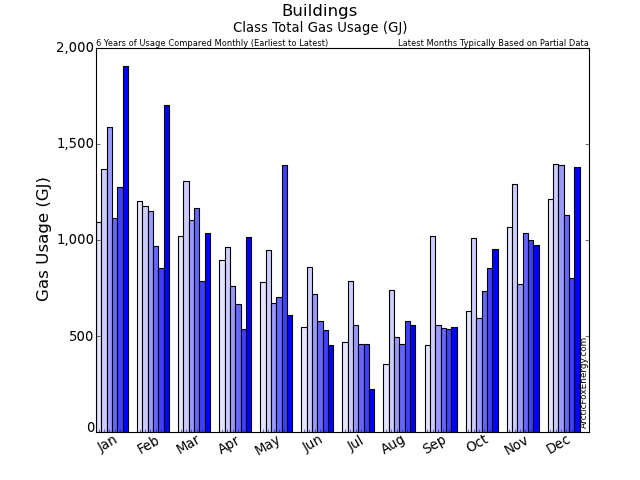
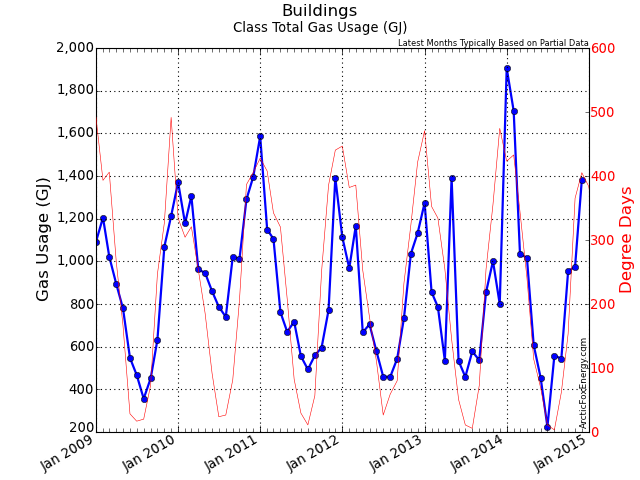
Monthly Gas Data
| Date | Adj Gas Usage (GJ) | Read Usage (GJ) | Gas Cost ($) | Basic / Mgmt Cost ($) | Delivery Cost ($) | Midstream Cost ($) | Total Gas Cost ($) | GHG (tCO2e) |
|---|---|---|---|---|---|---|---|---|
| Jan 2013 | 1,274.06 | 1,274.06 | 12,381.38 | 233.36 | 0.00 | 0.00 | 13,221.77 | 63.38 |
| Feb 2013 | 855.56 | 855.56 | 9,480.12 | 231.18 | 0.00 | 0.00 | 10,202.15 | 42.56 |
| Mar 2013 | 786.41 | 786.41 | 8,501.14 | 224.72 | 0.00 | 0.00 | 9,176.74 | 39.12 |
| Apr 2013 | 534.39 | 534.39 | 5,076.89 | 183.74 | 0.00 | 0.00 | 5,600.22 | 26.59 |
| May 2013 | 1,391.45 | 1,391.45 | 13,525.07 | 712.56 | 0.00 | 0.00 | 14,569.69 | 69.22 |
| Jun 2013 | 532.98 | 532.98 | 5,401.31 | 347.20 | 0.00 | 0.00 | 6,070.62 | 26.52 |
| Jul 2013 | 458.60 | 458.60 | 4,827.10 | 360.15 | 0.00 | 0.00 | 5,466.95 | 22.82 |
| Aug 2013 | 577.68 | 577.68 | 5,076.52 | 362.49 | 0.00 | 0.00 | 5,798.11 | 28.74 |
| Sep 2013 | 536.73 | 536.73 | 4,372.72 | 343.09 | 0.00 | 0.00 | 5,085.35 | 26.70 |
| Oct 2013 | 854.56 | 854.56 | 8,977.24 | 396.65 | 0.00 | 0.00 | 9,758.74 | 42.51 |
| Nov 2013 | 1,001.11 | 1,001.11 | 10,198.82 | 363.27 | 0.00 | 0.00 | 10,970.16 | 49.81 |
| Dec 2013 | 799.64 | 799.64 | 7,647.42 | 159.21 | 0.00 | 0.00 | 8,344.61 | 39.78 |
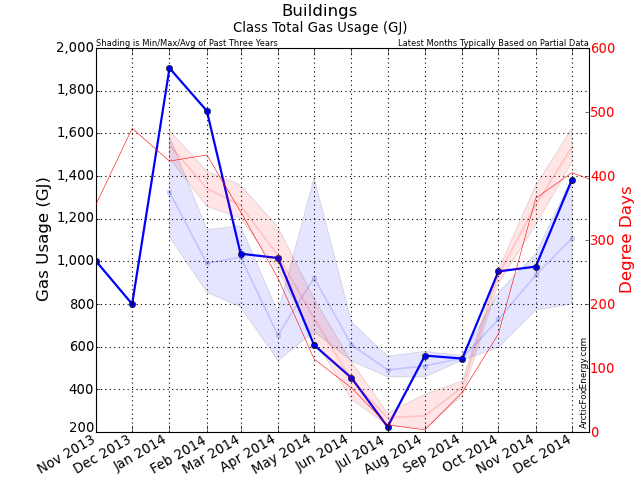
| Jan 2014 | 1,905.67 | 1,844.77 | 19,360.61 | 455.56 | 0.00 | 0.00 | 20,297.44 | 94.81 |
| Feb 2014 | 1,705.19 | 1,766.09 | 19,428.53 | 480.55 | 0.00 | 0.00 | 20,296.41 | 84.83 |
| Mar 2014 | 1,035.78 | 1,035.78 | 10,077.20 | 353.64 | 0.00 | 0.00 | 10,848.90 | 51.53 |
| Apr 2014 | 1,015.56 | 1,015.56 | 11,375.88 | 372.19 | 0.00 | 0.00 | 12,097.85 | 50.52 |
| May 2014 | 607.42 | 607.42 | 5,649.45 | 324.98 | 0.00 | 0.00 | 6,246.48 | 30.22 |
| Jun 2014 | 453.78 | 453.78 | 4,575.42 | 344.95 | 0.00 | 0.00 | 5,206.89 | 22.58 |
| Jul 2014 | 224.43 | 224.43 | 1,732.23 | 22.23 | 0.00 | 0.00 | 2,099.23 | 11.17 |
| Aug 2014 | 558.18 | 558.18 | 5,807.69 | 521.76 | 0.00 | 0.00 | 6,712.92 | 27.77 |
| Sep 2014 | 544.29 | 544.29 | 4,995.17 | 362.13 | 0.00 | 0.00 | 5,782.54 | 27.08 |
| Oct 2014 | 952.79 | 744.56 | 7,272.30 | 379.31 | 0.00 | 0.00 | 8,175.57 | 47.40 |
| Nov 2014 | 975.36 | 644.89 | 6,916.93 | 175.65 | 675.77 | 392.36 | 9,483.80 | 48.52 |
| Dec 2014 | 1,382.75 | 1,642.57 | 14,015.78 | 479.30 | 2,636.97 | 1,516.70 | 21,932.78 | 68.79 |
Download Monthly Gas Data as a CSV file for import into Excel.
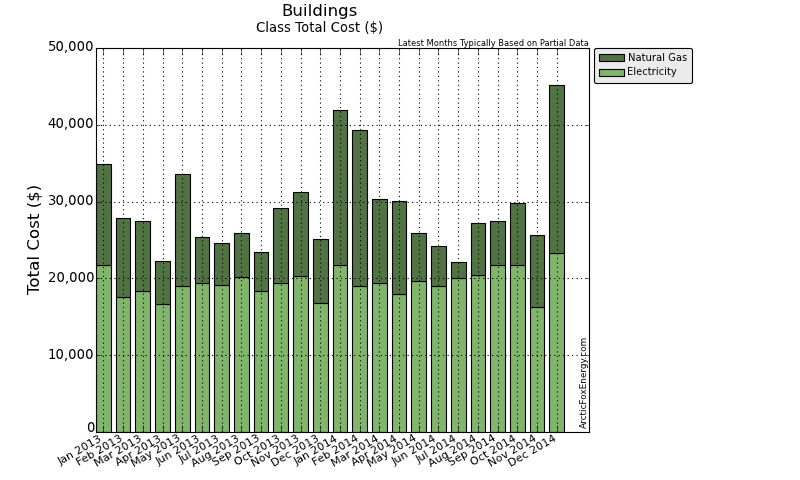
Monthly Total Data
| Date | Adj Gas Usage (GJ) | Total Gas Cost ($) | Adj Elec Usage (kWh) | Total Elec Cost ($) | Total Usage (ekWh) | Total Cost ($) | GHG (tCO2e) |
|---|---|---|---|---|---|---|---|
| Jan 2013 | 1,274.06 | 13,221.77 | 341,028.64 | 21,692.21 | 694,934.61 | 34,913.97 | 68.16 |
| Feb 2013 | 855.56 | 10,202.15 | 312,757.10 | 17,642.18 | 550,412.91 | 27,844.33 | 46.94 |
| Mar 2013 | 786.41 | 9,176.74 | 328,963.55 | 18,327.96 | 547,411.01 | 27,504.71 | 43.73 |
| Apr 2013 | 534.39 | 5,600.22 | 306,330.78 | 16,631.49 | 454,773.48 | 22,231.71 | 30.87 |
| May 2013 | 1,391.45 | 14,569.69 | 318,443.64 | 18,988.61 | 704,958.60 | 33,558.30 | 73.68 |
| Jun 2013 | 532.98 | 6,070.62 | 307,893.24 | 19,360.52 | 455,942.45 | 25,431.14 | 30.83 |
| Jul 2013 | 458.60 | 5,466.95 | 332,605.41 | 19,150.27 | 459,993.55 | 24,617.21 | 27.47 |
| Aug 2013 | 577.68 | 5,798.11 | 343,166.68 | 20,177.31 | 503,632.06 | 25,975.42 | 33.54 |
| Sep 2013 | 536.73 | 5,085.35 | 300,930.67 | 18,401.67 | 450,021.19 | 23,487.02 | 30.92 |
| Oct 2013 | 854.56 | 9,758.74 | 296,771.77 | 19,352.49 | 534,149.44 | 29,111.23 | 46.67 |
| Nov 2013 | 1,001.11 | 10,970.16 | 321,402.25 | 20,249.18 | 599,489.37 | 31,219.34 | 54.31 |
| Dec 2013 | 799.64 | 8,344.61 | 341,717.25 | 16,802.64 | 563,840.76 | 25,147.25 | 44.57 |
| Jan 2014 | 1,905.67 | 20,297.44 | 368,975.57 | 21,681.15 | 898,328.91 | 41,978.60 | 98.50 |
| Feb 2014 | 1,705.19 | 20,296.41 | 335,098.73 | 19,052.85 | 808,763.97 | 39,349.26 | 88.18 |
| Mar 2014 | 1,035.78 | 10,848.90 | 309,220.11 | 19,445.26 | 596,937.29 | 30,294.17 | 54.62 |
| Apr 2014 | 1,015.56 | 12,097.85 | 290,107.23 | 17,933.27 | 572,206.49 | 30,031.13 | 53.43 |
| May 2014 | 607.42 | 6,246.48 | 292,876.66 | 19,720.97 | 461,603.59 | 25,967.46 | 33.15 |
| Jun 2014 | 453.78 | 5,206.89 | 290,298.13 | 18,989.04 | 416,349.09 | 24,195.93 | 25.48 |
| Jul 2014 | 224.43 | 2,099.23 | 306,294.90 | 20,022.79 | 368,635.58 | 22,122.03 | 14.23 |
| Aug 2014 | 558.18 | 6,712.92 | 312,970.55 | 20,485.58 | 468,020.17 | 27,198.50 | 30.90 |
| Sep 2014 | 544.29 | 5,782.54 | 283,899.51 | 21,743.71 | 435,091.46 | 27,526.25 | 29.92 |
| Oct 2014 | 952.79 | 8,175.57 | 306,652.71 | 21,706.05 | 571,315.76 | 29,881.62 | 50.47 |
| Nov 2014 | 975.36 | 9,483.80 | 308,353.64 | 16,228.26 | 579,287.67 | 25,712.06 | 51.61 |
| Dec 2014 | 1,382.75 | 21,932.78 | 309,538.13 | 23,265.18 | 693,634.61 | 45,197.96 | 71.89 |
Download Monthly Total Data as a CSV file for import into Excel.
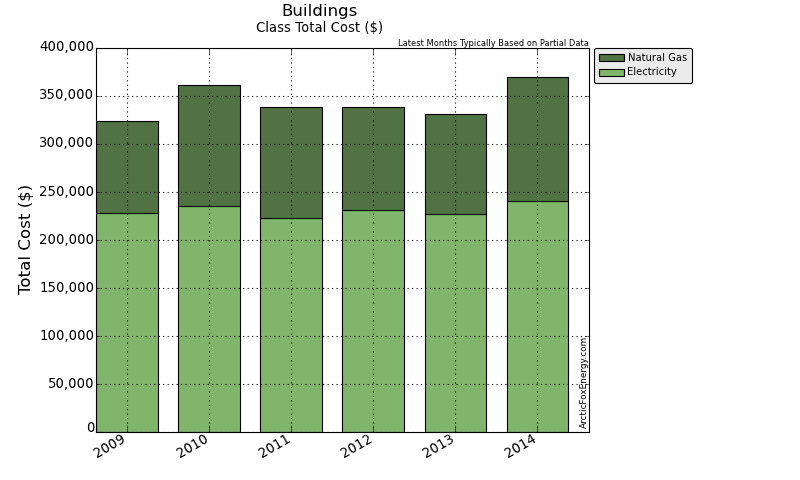
Yearly Data
| Date | Gas Usage (GJ) | Total Gas Cost ($) | Elec Usage (kWh) | Total Elec Cost ($) | Total Usage (ekWh) | Total Cost ($) | GHG (tCO2e) |
|---|---|---|---|---|---|---|---|
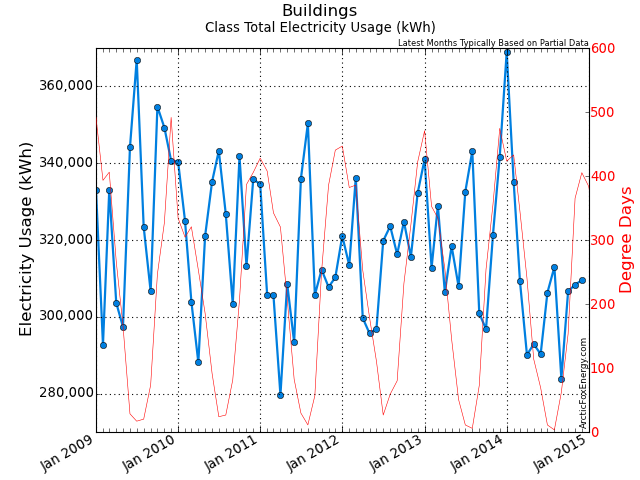
| 2009 | 9,727.57 | 95,498.46 | 3,945,701.17 | 228,614.13 | 6,647,804.10 | 324,112.59 | 586.53 |
| 2010 | 12,869.10 | 126,700.11 | 3,877,678.61 | 235,234.19 | 7,452,428.99 | 361,934.29 | 741.06 |
| 2011 | 10,354.88 | 115,500.50 | 3,749,648.98 | 222,986.03 | 6,626,004.86 | 338,486.53 | 608.90 |
| 2012 | 9,558.78 | 107,171.64 | 3,795,260.75 | 231,288.31 | 6,450,476.11 | 338,459.94 | 570.43 |
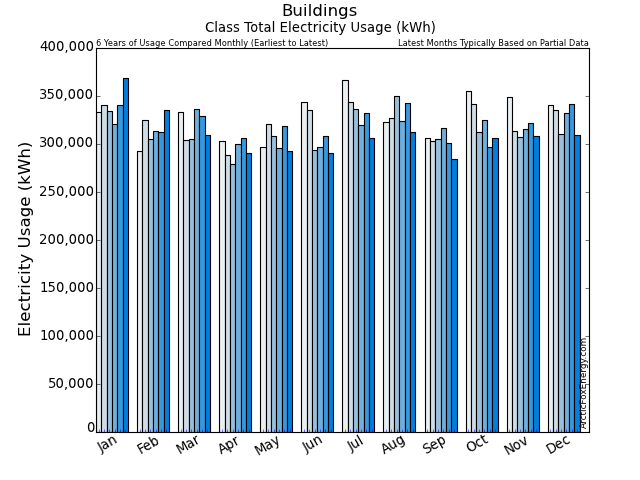
| 2013 | 9,603.17 | 104,265.12 | 3,852,010.99 | 226,776.51 | 6,519,559.45 | 331,041.64 | 531.69 |
| 2014 | 11,361.20 | 129,180.82 | 3,714,285.87 | 240,274.13 | 6,870,174.58 | 369,454.95 | 602.36 |
Download Yearly Data as a CSV file for import into Excel.
Notes
Please view the Report Notes page for important details about this report.
If any data appears unusual, please contact info@ArcticFoxEnergy.com for a manual verification. If any anomalies are detected, they will be immediately corrected.
